
WILL MAKE YOU A SUCCESSFUL STOCK MARKET TRADER IN 30 DAYS.
Chart patterns For
INTRADAY TRADING | SWING TRADING
SCALPING TRADING |LONG TERM TRADING
JOIN WITH US | LEARN - EARN - SUCCESS
CALL NOW : +91 - 94-94-64-15-85

Chart Patterns identification in Stock Market Course Trading Training in Master's Academy Ameerpet, Hyderabad Telangana.
Mastering Chart Patterns: A Comprehensive Guide for Traders and Investors
Chart patterns have long been one of the most crucial tools used by traders and investors in analyzing financial markets. Whether you’re a seasoned professional or just getting started, understanding chart patterns is key to interpreting market movements and making informed decisions. In this guide, we’ll delve deep into chart patterns, what they are, how to recognize them, and why they are so important in trading.
What Are Chart Patterns?
At its core, chart patterns are graphical representations of price movements over time. These patterns are created by plotting the price of an asset on a chart, typically using candlesticks, lines, or bars. Traders and investors look at these patterns to predict future price movements based on past market behavior.
Chart patterns can be divided into two broad categories:
- Reversal Patterns: These signal a potential change in the current trend, either from a bullish (uptrend) to a bearish (downtrend) or vice versa.
- Continuation Patterns: These suggest that the current trend is likely to continue after a brief period of consolidation or indecision.
Recognizing these patterns allows traders to anticipate market movements and make decisions based on the probability of specific outcomes.
The Importance of Chart Patterns in Trading
Chart patterns are not foolproof, but they have a high success rate when used correctly. Here’s why they are so essential:
- Predicting Market Movements: By studying historical price data, chart patterns can give insights into future price directions.
- Managing Risk: Identifying chart patterns helps traders understand potential risks. This enables them to set stop-loss orders and manage their trades more effectively.
- Understanding Market Psychology: Chart patterns reflect collective market sentiment. Recognizing these patterns gives traders a psychological edge, as they can tap into the emotions driving market behavior.
Commonly Used Chart Patterns
There are dozens of chart patterns used by traders, but the most well-known and widely used include:
1. Head and Shoulders
The Head and Shoulders pattern is one of the most reliable reversal patterns. It signals a potential reversal from an uptrend to a downtrend. It consists of three peaks:
- The first peak is the left shoulder.
- The second, higher peak is the head.
- The third peak is the right shoulder, which is lower than the head but similar in height to the left shoulder.
Once the price breaks below the neckline (a support line drawn connecting the lows), the trend is considered reversed, and traders may enter a short position.
2. Double Top and Double Bottom
The Double Top and Double Bottom are both reversal patterns. A Double Top is a bearish pattern that occurs after an uptrend and signals a potential trend reversal. The price forms two peaks at roughly the same level, followed by a break below the support level between the peaks.
Conversely, the Double Bottom is a bullish pattern that signals the end of a downtrend. It forms two troughs at nearly the same level, followed by a break above the resistance level between the troughs.
3. Triangles
Triangle patterns are continuation patterns that indicate periods of consolidation before the market breaks out in either direction. There are three types of triangles:
- Symmetrical Triangle: This pattern is formed when the price converges between rising support and falling resistance lines. The breakout can occur in either direction.
- Ascending Triangle: This pattern is characterized by a flat top resistance and rising support. It is typically a bullish continuation pattern.
- Descending Triangle: This pattern is characterized by a flat bottom support and falling resistance. It is typically a bearish continuation pattern.
4. Flags and Pennants
Flags and Pennants are short-term continuation patterns that typically form after a sharp price movement, followed by a brief consolidation before the trend resumes.
- Flag Pattern: The flag is a small rectangular-shaped consolidation area that slopes against the prevailing trend.
- Pennant Pattern: The pennant is a small symmetrical triangle that forms after a sharp price movement.
Both patterns usually indicate that the prior trend is likely to continue once the price breaks out of the consolidation range.
5. Cup and Handle
The Cup and Handle is a bullish continuation pattern that looks like the shape of a teacup. It starts with a rounded bottom (the cup), followed by a slight pullback (the handle), and then a breakout to the upside. This pattern typically signals that a stock will continue its upward trend after a period of consolidation.
How to Use Chart Patterns for Trading
Understanding and recognizing chart patterns is only the first step. To successfully use them for trading, here are a few tips to consider:
1. Confirm with Volume
Volume plays an essential role in validating chart patterns. For example, a breakout from a pattern is often more reliable when it is accompanied by higher-than-average volume. A lack of volume during a breakout can signal that the price move may not be sustainable.
2. Use Other Technical Indicators
While chart patterns are powerful tools, they work best when used alongside other technical indicators such as Moving Averages, RSI (Relative Strength Index), MACD (Moving Average Convergence Divergence), and Bollinger Bands. These indicators help confirm the strength and direction of the trend.
3. Understand the Market Context
Chart patterns should be analyzed in the context of the broader market. For instance, a Head and Shoulders pattern might have more significance if the broader market is showing signs of weakness. Understanding macroeconomic factors and news events is also crucial when interpreting chart patterns.
4. Risk Management
Even the best traders don’t win every trade. Risk management is key when using chart patterns. Set stop-loss orders at logical levels based on the pattern you are trading, and always calculate your risk-to-reward ratio before entering a trade.
The Role of Chart Patterns in Day Trading vs. Long-Term Investing
The relevance of chart patterns differs depending on your trading style:
- Day Traders: For day traders, chart patterns are essential for identifying quick price movements and entry/exit points within a single trading day. They focus on short-term patterns such as flags, pennants, and triangles.
- Long-Term Investors: For investors holding positions over weeks, months, or even years, chart patterns can help in identifying major trend changes. Reversal patterns such as the Head and Shoulders or Double Bottoms are more significant for long-term investors who want to capture larger price moves.
Common Mistakes to Avoid When Trading Chart Patterns
Chart pattern analysis is not foolproof, and there are common mistakes traders make that can reduce their chances of success. Some of these include:
- Ignoring Trend Direction: Entering trades against the dominant trend can be risky. Always ensure the overall market sentiment aligns with the pattern.
- Premature Entry: Entering a trade before the pattern is fully confirmed can lead to false breakouts. Wait for confirmation before acting.
- Overtrading: Trying to trade every pattern that forms can lead to losses. Focus on high-quality setups with strong risk-reward ratios.
Conclusion
Chart patterns are an indispensable tool for traders and investors, offering valuable insights into market sentiment and potential future price movements. By understanding the most common chart patterns and applying them with a sound risk management strategy, you can improve your trading performance and increase your chances of success.
Remember, while chart patterns can be incredibly useful, they should be used in conjunction with other technical indicators and an understanding of the broader market context. Practice and experience will help you recognize high-quality chart patterns and enhance your trading strategy over time.
By honing your ability to interpret chart patterns, you can unlock a deeper understanding of market behavior and improve your trading skills. Whether you’re day trading or investing for the long term, chart patterns remain one of the most effective tools for navigating the complexities of financial markets

Master's Academy - 25 Stock Chart Patterns Every Stock Market Traders Should Know
Ascending Triangle Pattern

Symmetrical Triangle Pattern

Descending Triangle Pattern

Bump And Run Pattern

Cup And Handle Pattern
Double Bottom Pattern

Double Top Pattern

Falling Wedge Pattern
Flag Pattern

Pennant Pattern
Head And Shoulders Top Pattern

Inverse Head And Shoulders Pattern

Rounding Bottom Pattern

Price Channel Pattern

Triple Top Reversal Pattern

Triple Bottom Reversal Pattern
Bullish Flag Pattern

Bearish Flag Pattern
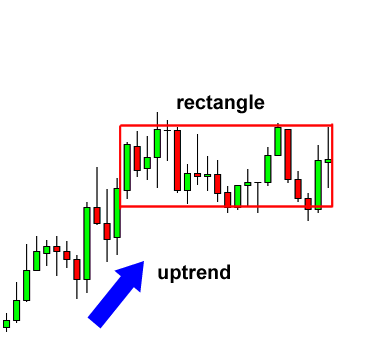
Bullish Rectangle Pattern
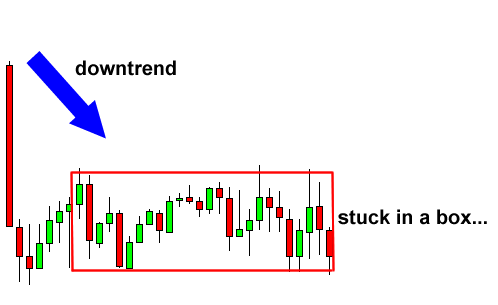
Bearish Rectangle Pattern

Bullish Pennant Pattern
Bearish Pennant Pattern

Reverse Cup And Handle Pattern
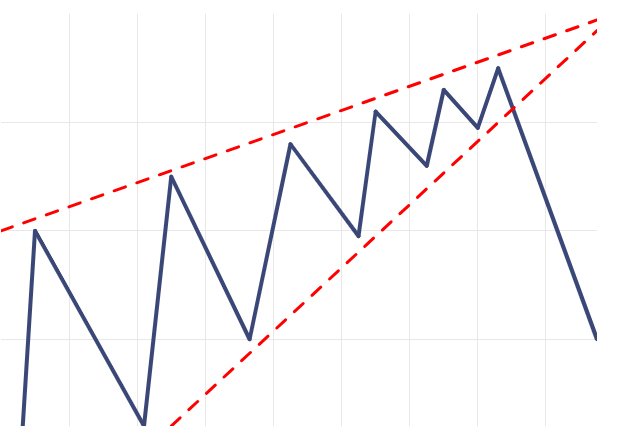
Rising Wedge : Downtrend Continues Pattern

Bullish 123 Pattern

Bearish 123 Pattern
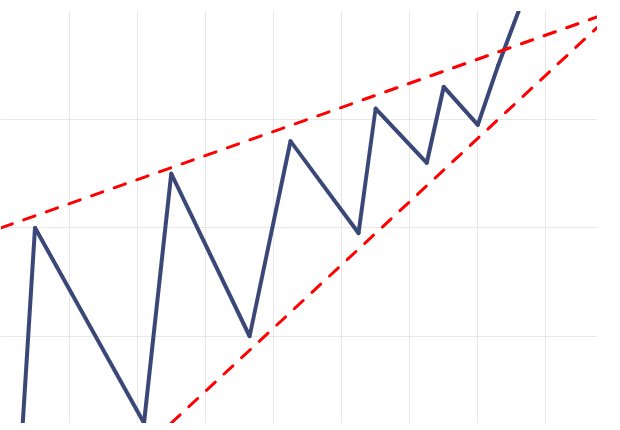
Rising Wedge : Uptrend Continues Pattern
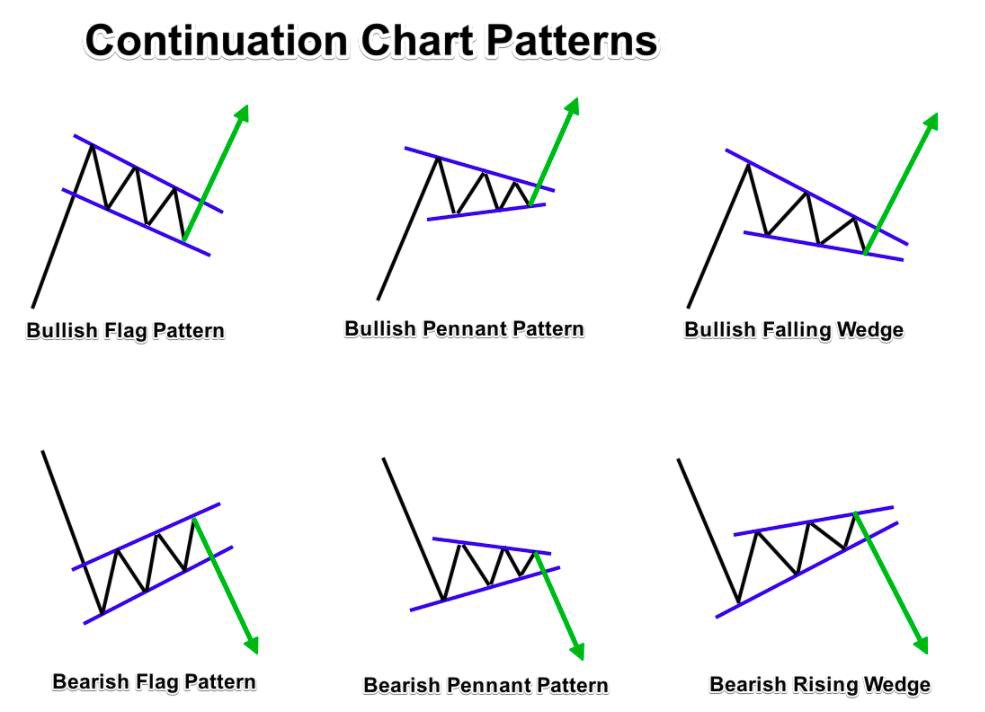
Continuation Chart Patterns

Reversal Chart Patterns

Bullish Continuation Pattern
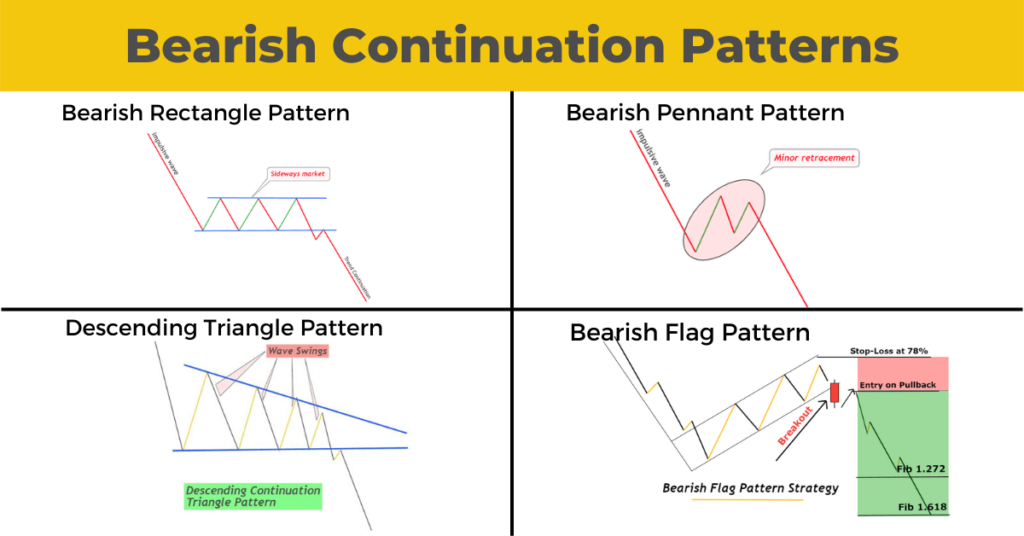
Bearish Continuation Pattern
Ascending Triangle Chart Pattern : A Comprehensive Guide
The Ascending Triangle Pattern: A Comprehensive Guide for Traders and Investors
When it comes to technical analysis, few chart patterns are as reliable and widely recognized as the Ascending Triangle Pattern. Understanding how to identify and trade this pattern can give traders a significant advantage in predicting future market movements. Whether you’re a seasoned trader or a beginner, mastering the Ascending Triangle Pattern can enhance your ability to make informed decisions in the financial markets.
In this article, we’ll dive deep into the Ascending Triangle Pattern, exploring its characteristics, significance, how to trade it, and common mistakes to avoid. By the end, you’ll have a complete understanding of how to utilize this pattern in your trading strategy.
What Is the Ascending Triangle Pattern?
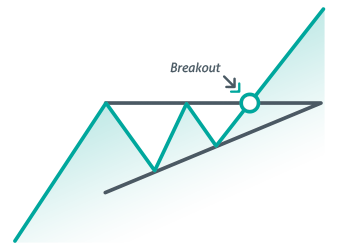
The Ascending Triangle Pattern is a bullish continuation pattern that occurs when the price consolidates between a rising trendline (support) and a horizontal resistance line. It signifies that there is an increasing pressure to the upside, and traders expect the price to eventually break through the resistance level. This pattern is typically seen during uptrends and signals that the asset is likely to continue rising after the breakout.
Characteristics of the Ascending Triangle Pattern
To identify the Ascending Triangle Pattern in a chart, there are a few key characteristics to look for:
Upward Sloping Trendline (Support): This is formed by connecting a series of higher lows. It shows that buyers are becoming more aggressive, willing to buy at higher prices.
Flat Resistance Line (Horizontal Resistance): The resistance line is horizontal, indicating that sellers are consistently attempting to push the price back down at the same level.
Higher Lows: As the price moves upward, it creates a series of higher lows. This indicates that buyers are in control and the demand for the asset is increasing.
Volume: During the formation of the ascending triangle, volume typically decreases as the pattern develops. However, volume tends to increase significantly once the breakout occurs.
Breakout Point: The pattern completes when the price breaks above the horizontal resistance line, signaling a potential continuation of the uptrend.
Why is the Ascending Triangle Pattern Important in Trading?
The Ascending Triangle Pattern holds significant importance in technical analysis for several reasons. Here are some of the main benefits that make this pattern valuable:
Predictive Power: The ascending triangle is often a strong indicator that an asset is about to break to the upside. This makes it a reliable tool for traders looking to capitalize on trends.
Risk-Reward Ratio: This pattern tends to offer an attractive risk-to-reward ratio. Traders can set stop-loss orders just below the rising trendline (support), which minimizes risk while providing the potential for significant reward if the price breaks through resistance.
Trend Continuation: Unlike reversal patterns, which signal the end of a trend, the ascending triangle pattern indicates that the existing uptrend will likely continue. This makes it ideal for traders who prefer to trade with the trend.
How to Identify the Ascending Triangle Pattern in Charts
Recognizing the Ascending Triangle Pattern in real-time charting requires practice, but with the following steps, you’ll be able to spot it with ease:
Locate the Uptrend: Before identifying the ascending triangle, ensure that the asset is in an uptrend. The pattern is more effective when it forms during an uptrend, signaling the continuation of the bullish move.
Draw the Trendline (Support): To draw the support line, connect the higher lows. The support line should slope upwards, showing that demand is increasing at higher price levels.
Draw the Resistance Line: The resistance line is horizontal, formed by connecting the highs where the price fails to break above during previous attempts.
Wait for the Breakout: Once the pattern forms, traders should wait for a breakout above the resistance line. The breakout confirms the pattern and signals that the price is likely to continue higher.
Volume Confirmation: Look for a surge in volume once the breakout occurs. Increased volume confirms that the breakout is legitimate and not a false signal.
Trading the Ascending Triangle Pattern
Knowing how to identify the Ascending Triangle Pattern is one thing, but knowing how to trade it is another. Let’s break down a step-by-step guide to trading this pattern effectively:
Step 1: Entry Point
The ideal entry point occurs once the price breaks above the resistance line. This breakout signals that the upward pressure has finally overwhelmed the selling pressure, and the price is likely to move higher.
- Buy on the Breakout: As soon as the price breaks above the resistance, traders can enter a long position. It’s crucial to confirm the breakout with an increase in volume, as this adds validity to the move.
Step 2: Stop Loss
Risk management is critical when trading any chart pattern, and the Ascending Triangle is no exception.
- Place Stop-Loss Below Support: A stop-loss order can be placed just below the ascending support line. This limits potential losses if the breakout turns out to be false and the price moves back within the pattern.
Step 3: Target Price
Setting a target price involves determining the price level that you expect the asset to reach after breaking out from the triangle.
Measure the Height of the Triangle: To calculate the target price, measure the height of the triangle (from the flat resistance to the lowest point of the ascending support). Add this distance to the breakout point to estimate the price target.
Example: If the resistance level is $50, and the distance from the support line to the resistance line is $5, the target price would be $55.
Step 4: Exit Strategy
As the price approaches the target price, traders should monitor the chart for signs of weakening momentum. If the price shows signs of stalling or forming a new pattern (like a reversal pattern), it may be time to exit.
Advanced Techniques for Trading the Ascending Triangle Pattern
For traders looking to enhance their trading strategy, here are some advanced techniques for trading the Ascending Triangle Pattern:
1. Confirmation with Indicators
While the Ascending Triangle is a strong pattern on its own, confirmation from other technical indicators can improve the reliability of your trade. Here are a few indicators to consider:
- RSI (Relative Strength Index): An RSI reading above 50 confirms that the asset is in a bullish phase. If the RSI is already showing bullish strength when the pattern forms, the breakout is more likely to succeed.
- MACD (Moving Average Convergence Divergence): A bullish crossover of the MACD (when the shorter-term moving average crosses above the longer-term moving average) can confirm the bullish breakout.
- Volume: As mentioned earlier, volume is a critical confirmation tool. A breakout with high volume provides stronger confirmation that the price is likely to continue upward.
2. Combining with Other Chart Patterns
The Ascending Triangle can sometimes be used in conjunction with other chart patterns, such as the Cup and Handle or Flag Patterns, to improve your chances of success. For instance, if an Ascending Triangle forms after a Cup and Handle pattern, the breakout is likely to be even stronger.
3. Risk Management and Position Sizing
Traders should never risk more than they are willing to lose. Proper position sizing based on the size of the stop-loss and the potential reward will help you manage risk effectively.
Common Mistakes to Avoid When Trading the Ascending Triangle Pattern
Even experienced traders make mistakes when trading the Ascending Triangle Pattern. Here are some common errors to avoid:
1. Entering Too Early
It’s tempting to jump in as soon as the pattern starts to form, but patience is essential. Entering the trade too early before the breakout could lead to losses if the price fails to break above resistance.
2. Ignoring Volume
Volume is one of the most important aspects of the breakout. A low-volume breakout could be a false signal, and traders should avoid entering a trade without volume confirmation.
3. Failing to Adjust Stop-Loss
As the price moves higher, it’s important to adjust your stop-loss to lock in profits and protect your position. Failing to do so can result in giving back gains if the price retraces.
Conclusion About The Ascending Triangle Pattern
The Ascending Triangle Pattern is one of the most reliable and powerful chart patterns for predicting price movements. Understanding how to identify, trade, and manage risk with this pattern can significantly enhance your trading strategy. With practice and attention to detail, you can use the Ascending Triangle to make more informed decisions and capitalize on bullish trends.
Remember, successful trading isn’t just about spotting patterns but also about maintaining discipline, managing risk, and staying patient. By incorporating the Ascending Triangle Pattern into your trading toolkit, you’ll be better equipped to navigate the financial markets and make profitable trades.
Symmetrical Triangle Pattern: A Comprehensive Guide
Understanding the Symmetrical Triangle Pattern: A Comprehensive Guide for Traders and Investors
Introduction
In the world of technical analysis, one of the most significant chart patterns to look out for is the Symmetrical Triangle Pattern. Traders and investors alike rely on this pattern to predict market trends and make informed decisions. The Symmetrical Triangle can appear during various market conditions, and understanding its nuances is crucial for anyone involved in trading or investing.
In this article, we’ll dive deep into the details of the Symmetrical Triangle Pattern — its formation, significance, and how to trade it effectively. We will also highlight real-world examples and tips for maximizing the potential of this technical tool.
What is a Symmetrical Triangle Pattern?
The Symmetrical Triangle pattern is one of the most common continuation chart patterns in technical analysis. It occurs when the price of an asset moves within converging trendlines, creating a triangle shape. The upper trendline connects the lower highs, and the lower trendline connects the higher lows, forming a symmetrical structure.
This pattern is called “symmetrical” because both sides (the upper and lower trendlines) are nearly identical in slope, creating a sense of balance. The Symmetrical Triangle pattern typically signifies a period of consolidation where market participants are indecisive, and the price range narrows over time.
How is the Symmetrical Triangle Pattern Formed?
The formation of a Symmetrical Triangle pattern typically involves three distinct phases:
Initial Trend (Uptrend or Downtrend): Before the pattern forms, the price of an asset generally follows a clear trend (either upward or downward). The Symmetrical Triangle pattern then begins to develop as the price consolidates in a narrower range.
Consolidation Phase: As the price continues to move in a contracting range, the highs get lower, and the lows get higher. This consolidation phase forms the shape of a triangle, where both trendlines move closer together over time.
Breakout: Eventually, the price will break out from the apex of the triangle, signaling the potential continuation of the previous trend. The breakout direction (up or down) indicates the likely direction of the next price move.
Key Characteristics of the Symmetrical Triangle Pattern
Trendlines: The defining feature of the Symmetrical Triangle is its trendlines. These trendlines should converge, with the upper trendline showing lower highs and the lower trendline showing higher lows.
Volume: Volume plays a crucial role in confirming the pattern. During the consolidation phase, volume usually decreases, reflecting the indecisiveness of the market. However, during the breakout, volume tends to increase, indicating the strength of the move.
Duration: The duration of the triangle can vary, but it usually takes several weeks or months to form. Shorter triangles can signal quicker price movements, while longer triangles suggest that the market needs more time to reach a decision.
Why Does the Symmetrical Triangle Pattern Matter?
The Symmetrical Triangle Pattern provides valuable insights into market sentiment. Here’s why it matters:
Indicates Market Consolidation: This pattern often forms during periods of market indecision, where buyers and sellers are in a tug-of-war. Traders use this consolidation phase to predict a breakout in one direction.
Signifies Continuation: In most cases, the Symmetrical Triangle pattern is a continuation pattern. This means that the price tends to move in the same direction as the prevailing trend before the pattern formed. However, it’s essential to note that the breakout direction is not always predictable.
Helps Identify Breakout Opportunities: Once the price breaks out of the triangle, it offers traders an opportunity to enter a position aligned with the breakout direction. By recognizing the pattern early, traders can maximize potential gains.
How to Trade the Symmetrical Triangle Pattern
Trading the Symmetrical Triangle Pattern requires a careful and strategic approach. Below are some practical tips and steps to help you trade this pattern effectively:
1. Wait for the Breakout Confirmation
One of the most critical steps in trading the Symmetrical Triangle Pattern is waiting for the breakout confirmation. Don’t rush to enter a trade before the breakout happens, as the price can often stall or reverse before breaking out. Here’s how to spot a breakout:
Upward Breakout: If the price breaks above the upper trendline, it’s considered a bullish breakout. A strong upward move following the breakout may indicate a continuation of the previous uptrend.
Downward Breakout: If the price breaks below the lower trendline, it’s considered a bearish breakout. A strong downward move after the breakout may indicate a continuation of the previous downtrend.
2. Use Volume to Confirm the Breakout
Volume is a crucial indicator when trading the Symmetrical Triangle Pattern. A breakout with increasing volume provides more confidence that the price will continue in the breakout direction. If the breakout occurs with low volume, it may be a false breakout, and the price could reverse back into the triangle.
3. Set Entry and Exit Points
Once you’ve identified the breakout direction, it’s time to set entry and exit points. Consider the following:
Entry: Enter the trade after the breakout is confirmed, and the price closes above or below the trendlines, depending on the direction.
Target Price: Measure the height of the triangle (from the base to the highest point) and project it in the breakout direction. This projection can give you a target price for your trade.
Stop Loss: Place your stop loss just below the lower trendline for a bullish breakout or just above the upper trendline for a bearish breakout. This way, you can manage your risk effectively.
4. Consider Timeframe and Market Conditions
Different timeframes may influence the success of the Symmetrical Triangle pattern. A pattern on a daily chart may have more significance than one on a 5-minute chart, for example. Always take into account broader market conditions and trends before making a trade based solely on a pattern.
Real-World Examples of Symmetrical Triangle Patterns
To make the theory more tangible, let’s look at some real-world examples. Traders often observe the Symmetrical Triangle pattern on various asset classes, including stocks, forex, and commodities.
Stock Market Example: Let’s say a tech stock has been in an uptrend but starts consolidating in a Symmetrical Triangle pattern. As the price approaches the apex of the triangle, it breaks to the upside, and the stock continues its upward momentum. Traders who identified the pattern early could have entered the trade and profited from the breakout.
Forex Market Example: In the forex market, the Symmetrical Triangle often forms during times of market indecision before the release of major economic data. For instance, a currency pair might form a Symmetrical Triangle before breaking out in the direction of the prevailing trend after the news is released.
Common Mistakes to Avoid When Trading the Symmetrical Triangle Pattern
While the Symmetrical Triangle Pattern is a reliable tool, traders often make a few common mistakes:
Trading Too Early: Entering the market before the breakout is confirmed can lead to losses. Always wait for a clear breakout and volume confirmation before taking a position.
Ignoring Volume: Volume is crucial for confirming the validity of the breakout. If volume doesn’t increase during the breakout, the move could be a false signal.
Failure to Set Stop Loss: Always use a stop loss when trading the Symmetrical Triangle Pattern. Without proper risk management, traders can lose significant amounts in case the breakout turns out to be false.
Conclusion About The Symmetrical Triangle Pattern
The Symmetrical Triangle Pattern is an essential tool for technical traders, offering insights into price consolidation and potential breakout opportunities. By understanding its formation, key characteristics, and how to trade it, you can enhance your trading strategies and make better-informed decisions.
While this pattern does not guarantee success, when used alongside other indicators and analysis techniques, it can help you stay ahead of the market. Always remember to manage risk, practice patience, and use volume to confirm your trades for the best results.
FAQs About the Symmetrical Triangle Pattern
What is the Symmetrical Triangle Pattern? The Symmetrical Triangle Pattern is a technical chart pattern that indicates a period of consolidation, where the price moves within converging trendlines, signaling a potential breakout in either direction.
Is the Symmetrical Triangle a bullish or bearish pattern? The Symmetrical Triangle is typically a continuation pattern, meaning that the breakout direction depends on the prevailing trend before the pattern formed. An upward breakout signals a bullish trend, and a downward breakout signals a bearish trend.
How do I trade the Symmetrical Triangle Pattern? To trade the Symmetrical Triangle Pattern, wait for a breakout to occur, confirm the breakout with volume, and set entry, exit, and stop-loss points based on the direction of the breakout.
Can the Symmetrical Triangle Pattern fail? Yes, false breakouts can occur. It’s essential to use volume as a confirmation tool and set proper risk management strategies, including stop-loss orders.
Descending Triangle Chart Pattern : The Ultimate Guide For Traders
The Ultimate Guide to Descending Triangle Pattern in Trading
Introduction
The Descending Triangle Pattern is one of the most recognized chart patterns in technical analysis. It is a crucial tool used by traders to predict potential market movements, particularly bearish breakouts. Understanding this pattern can give traders an edge in identifying entry and exit points, minimizing risks, and maximizing profits.
In this comprehensive guide, we will dive deep into the Descending Triangle Pattern, its characteristics, trading strategies, and how you can leverage it to improve your trading skills.
What is a Descending Triangle Pattern?
A Descending Triangle Pattern is a bearish continuation chart pattern that signals the possibility of a downward breakout. It consists of a horizontal support line and a descending resistance line, forming a triangular shape.
Key Features:
Lower Highs – Price action forms progressively lower highs, indicating weakening buying momentum.
Strong Support Line – A horizontal line representing support where price touches multiple times before potentially breaking downward.
Bearish Bias – Typically, this pattern signals a continuation of a downtrend, but it can sometimes result in a bullish breakout if buyers gain control.
How to Identify a Descending Triangle Pattern?
To correctly identify a Descending Triangle Pattern, follow these steps:
Look for a Downtrend – This pattern generally forms during a bearish market phase.
Draw the Resistance Line – Identify lower highs and connect them to form a descending resistance line.
Identify the Support Level – Find the horizontal support line where price action touches multiple times.
Observe Volume Trends – A declining volume often accompanies this pattern, indicating potential breakout momentum.
The Psychology Behind the Descending Triangle Pattern
Understanding the market psychology behind this pattern can help traders make informed decisions.
Sellers in Control: The formation of lower highs suggests that sellers are dominating, applying increasing downward pressure on price action.
Buyers Defending Support: The horizontal support line shows that buyers are trying to hold the price steady, but the constant lower highs indicate weakening buying power.
Breakout Decision: Eventually, one side has to give in. More often than not, sellers overpower buyers, leading to a bearish breakout.
How to Trade the Descending Triangle Pattern
1. Entry Strategy
Once the price breaks below the horizontal support line, traders can enter a short position. Confirm the breakout by checking the volume—higher volume strengthens the breakout signal.
Steps:
Wait for the breakout confirmation below support.
Look for an increase in volume.
Enter a short position after the breakout candlestick closes below support.
2. Stop-Loss Placement
To manage risk effectively, place a stop-loss order just above the last lower high or the descending resistance line.
3. Profit Targeting
The price target can be estimated by measuring the height of the triangle and projecting that distance downward from the breakout point.
Formula: Target Price = Breakout Level – (Triangle Height)
4. Bullish Breakout Consideration
Though rare, sometimes the price breaks above the descending resistance line. Traders can enter a long position if this happens, but they should confirm it with strong volume and other technical indicators.
Real-World Examples of the Descending Triangle Pattern
Example 1: Bitcoin (BTC/USD)
In many cryptocurrency markets, Descending Triangle Patterns have led to sharp bearish movements. For instance, Bitcoin formed a descending triangle in 2018, resulting in a significant drop after breaking support.
Example 2: Stock Market – Tesla (TSLA)
Tesla has exhibited descending triangles before major sell-offs, making it a great pattern to watch for short-selling opportunities.
Best Indicators to Use With the Descending Triangle Pattern
Combining Descending Triangle Patterns with other indicators enhances accuracy:
Relative Strength Index (RSI): Helps identify overbought or oversold conditions.
Moving Averages (MA): The 50-day and 200-day MAs can confirm trend directions.
MACD (Moving Average Convergence Divergence): A bearish MACD crossover strengthens a descending triangle breakout signal.
Volume Analysis: Higher volume during a breakdown confirms strong momentum.
Common Mistakes to Avoid
Ignoring Volume Confirmation: Low volume breakouts may lead to false signals.
Entering Too Early: Always wait for a confirmed breakout before taking a position.
Poor Risk Management: Placing stop-loss orders too close can result in unnecessary stop-outs.
Misidentifying Patterns: Ensure that the support line is truly horizontal and not slightly sloping.
Conclusion About The Descending Triangle Chart Patterns
The Descending Triangle Pattern is a powerful tool for traders looking to capitalize on bearish market conditions. By correctly identifying the pattern, confirming breakouts with volume, and implementing proper risk management strategies, traders can significantly improve their success rates.
Whether you trade stocks, forex, or cryptocurrencies, incorporating the Descending Triangle Pattern into your strategy can enhance your technical analysis skills and help you make more informed trading decisions.
Key Takeaways
A Descending Triangle Pattern signals a potential bearish breakout.
Proper confirmation using volume and technical indicators is crucial.
Always apply risk management strategies like stop-loss and target pricing.
Combining this pattern with RSI, MACD, and Moving Averages improves accuracy.
By mastering the Descending Triangle Pattern, you can elevate your trading game and make more calculated moves in the market!
Bump and Run Pattern in Trading
The Ultimate Guide to the Bump and Run Pattern in Trading
Introduction
The Bump and Run Pattern is one of the most effective yet lesser-known chart patterns in technical analysis. It is a powerful tool that helps traders identify trend reversals after a sharp price movement. When understood correctly, this pattern can provide high-probability trading opportunities in stocks, forex, and cryptocurrencies.
In this guide, we will dive deep into the Bump and Run Pattern, covering its structure, significance, trading strategies, and how traders can use it to make informed market decisions.
What is the Bump and Run Pattern?
The Bump and Run Pattern is a reversal pattern that typically forms after a steep price movement. It consists of three key phases: the Lead-in Phase, the Bump Phase, and the Run Phase.
Key Features:
- Lead-in Phase: A steady price increase with a sustainable trend.
- Bump Phase: A sudden, excessive price increase, often driven by speculation or hype.
- Run Phase: A sharp reversal as the price corrects and returns to the original trendline.
This pattern can occur in both bullish and bearish markets, though it is most commonly used to identify bearish reversals after an unsustainable price surge.
How to Identify a Bump and Run Pattern
To correctly spot a Bump and Run Pattern, follow these steps:
- Look for a Gradual Uptrend – The price should show a steady increase before the bump.
- Identify the Bump Phase – A sharp, almost parabolic price movement occurs, deviating significantly from the trendline.
- Watch for a Breakdown – The price eventually reverses, breaking below the lead-in trendline.
- Confirm with Volume – High trading volume during the bump and declining volume before the breakdown can validate the pattern.
The Psychology Behind the Bump and Run Pattern
- Early Investors Benefit: During the lead-in phase, smart investors accumulate positions at a steady pace.
- Hype and FOMO Drive Prices Up: The bump phase occurs as retail traders rush in, pushing prices higher due to speculation and fear of missing out (FOMO).
- Reality Kicks In: Overbought conditions lead to a rapid price decline as early investors take profits.
- Panic Selling: As prices drop below the lead-in trendline, panic selling accelerates the decline, forming the run phase.
Understanding this psychology can help traders time their entries and exits better.
How to Trade the Bump and Run Pattern
1. Entry Strategy
Traders should enter a short position once the price breaks below the lead-in trendline, confirming the reversal.
Steps:
- Identify the bump phase with an excessive price increase.
- Wait for the price to break below the trendline.
- Confirm with increased volume and bearish indicators.
- Enter a short position once the breakout candle closes below the trendline.
2. Stop-Loss Placement
To manage risk effectively, place a stop-loss just above the bump phase or the most recent lower high before the breakdown.
3. Profit Targeting
Measure the height of the bump and project that distance downward from the breakout point to set a profit target.
Formula: Target Price = Breakdown Level – (Bump Height)
4. Bullish Bump and Run Pattern
Although rare, this pattern can also indicate a bullish reversal if the price recovers strongly after a significant drop. In such cases, traders should look for a breakout above the lead-in trendline before entering a long position.
Real-World Examples of the Bump and Run Pattern
Example 1: Bitcoin (BTC/USD)
Bitcoin has formed Bump and Run Patterns multiple times, especially during extreme price surges followed by sharp corrections.
Example 2: Tesla (TSLA)
Tesla stock has exhibited this pattern after speculative rallies, often leading to significant pullbacks.
Best Indicators to Use With the Bump and Run Pattern
Combining the Bump and Run Pattern with other indicators enhances its accuracy:
- Relative Strength Index (RSI): Identifies overbought conditions during the bump phase.
- Moving Averages (MA): The 50-day and 200-day MAs help confirm trend reversals.
- MACD (Moving Average Convergence Divergence): A bearish MACD crossover strengthens the pattern’s validity.
- Volume Analysis: Increased volume during the bump and breakout confirms strong momentum.
Common Mistakes to Avoid
- Ignoring Volume Confirmation: A weak volume breakout may lead to false signals.
- Entering Too Early: Always wait for a confirmed breakout before taking a position.
- Poor Risk Management: Using a stop-loss too close can result in premature exits.
- Misidentifying the Pattern: Ensure that the bump phase shows a sharp deviation from the lead-in trend.
Conclusion
The Bump and Run Pattern is a powerful reversal signal that traders can use to capitalize on excessive price movements. By correctly identifying the pattern, confirming breakouts with volume, and implementing proper risk management strategies, traders can significantly improve their success rates.
Whether you trade stocks, forex, or cryptocurrencies, incorporating the Bump and Run Pattern into your strategy can enhance your technical analysis skills and help you make more informed trading decisions.
Key Takeaways
- The Bump and Run Pattern signals a potential trend reversal after a sharp price increase.
- Confirmation using volume and technical indicators is crucial.
- Risk management through stop-loss and target pricing is essential.
- Combining this pattern with RSI, MACD, and Moving Averages improves accuracy.
By mastering the Bump and Run Pattern, you can elevate your trading skills and take advantage of market reversals with confidence!
Cup and Handle Pattern: A Trader’s Roadmap to Profitable Breakouts :
The Ultimate Guide to the Cup and Handle Pattern: A Trader’s Roadmap to Profitable Breakouts
Introduction
In the world of technical analysis, few chart patterns are as reliable and widely recognized as the Cup and Handle Pattern. First introduced by legendary trader William J. O’Neil, this formation is a powerful bullish continuation pattern that signals the potential for a strong upward breakout.
Whether you’re a beginner or an experienced trader, mastering the Cup and Handle Pattern can significantly improve your market timing and profitability. In this in-depth guide, we’ll explore everything you need to know about this pattern, from its structure and formation to effective trading strategies and real-world applications.
What is the Cup and Handle Pattern?
The Cup and Handle Pattern is a bullish continuation chart formation that appears after an asset experiences a period of consolidation. The pattern consists of two main components:
The Cup: A rounded, U-shaped curve that forms after a downtrend or correction. This represents a period of accumulation.
The Handle: A small downward consolidation or sideways movement following the cup. This forms due to minor profit-taking before the breakout.
Once the price breaks out from the handle with strong volume, it signals the beginning of a new bullish trend.
Key Characteristics of the Cup and Handle Pattern
Bullish Continuation: It typically occurs in an uptrend, indicating further price gains.
U-Shaped Cup: The cup should have a rounded bottom rather than a V-shaped one.
Handle Formation: A shallow pullback after the cup that lasts a few days to weeks.
Breakout Point: The breakout happens when the price moves above the handle’s resistance level.
Volume Expansion: The breakout is confirmed with increased trading volume.
How to Identify the Cup and Handle Pattern
Spotting the Cup and Handle Pattern correctly is crucial for successful trading. Follow these steps to identify the pattern:
Look for a Preceding Uptrend – The asset should be in an overall bullish trend before forming the pattern.
Identify the Rounded Cup Formation – The price gradually declines and then rises back to the previous high, forming a U-shape.
Observe the Handle Consolidation – A small pullback or sideways movement should follow the cup’s completion.
Monitor the Breakout Level – The breakout occurs when the price surpasses the handle’s resistance level.
Confirm with Volume – A breakout accompanied by high volume increases the reliability of the pattern.
Trading Strategies Using the Cup and Handle Pattern
1. Breakout Trading Strategy
Entry Point: Buy when the price breaks above the handle’s resistance.
Stop-Loss Placement: Set a stop-loss below the handle’s lowest point.
Profit Target: Measure the cup’s depth and project that distance upwards from the breakout point.
2. Retest Strategy
Sometimes, after the initial breakout, the price retests the breakout level before continuing higher.
Enter a trade when the price successfully bounces off the retest level.
This strategy reduces the risk of false breakouts.
3. Volume-Based Confirmation Strategy
A breakout with high volume confirms the strength of the pattern.
Avoid entering trades on low-volume breakouts, as they can be false signals.
Real-World Examples of the Cup and Handle Pattern
Example 1: Apple Inc. (AAPL)
Apple has shown multiple Cup and Handle formations over the years, leading to strong uptrends and profitable breakouts.
Example 2: Bitcoin (BTC/USD)
Cryptocurrencies, including Bitcoin, frequently display this pattern, signaling bullish breakouts in crypto markets.
Common Mistakes Traders Make with the Cup and Handle Pattern
Misidentifying the Pattern: Ensure the cup has a rounded bottom and the handle is not too deep.
Ignoring Volume Confirmation: A breakout without volume support may lead to failed trades.
Entering Too Early: Wait for a clear breakout above resistance before taking a position.
Setting Stop-Losses Too Tight: Giving the trade some room to breathe prevents premature stop-outs.
Conclusion About The Cup and Handle Pattern: A Trader’s Roadmap to Profitable Breakouts
The Cup and Handle Pattern is a powerful bullish continuation formation that provides traders with high-probability trading opportunities. By correctly identifying the pattern, using volume confirmation, and implementing sound risk management strategies, traders can enhance their profitability.
Whether you trade stocks, forex, or cryptocurrencies, incorporating the Cup and Handle Pattern into your trading toolkit can lead to more consistent success in the markets.
Key Takeaways:
The Cup and Handle Pattern signals a strong bullish continuation.
The cup should have a rounded bottom, and the handle should be a shallow pullback.
Breakout confirmation with high volume increases reliability.
Stop-loss placement and profit targets are essential for risk management.
Mastering the Cup and Handle Pattern takes practice, but once understood, it can become a valuable weapon in your trading arsenal!
Double Bottom Pattern: A Trader’s Blueprint for Profitable Reversals
The Ultimate Guide to the Double Bottom Pattern: A Trader’s Blueprint for Profitable Reversals
Introduction
Among the many chart patterns in technical analysis, the Double Bottom Pattern stands out as one of the most reliable bullish reversal formations. It helps traders identify potential trend reversals, providing excellent opportunities for profitable trades.
Whether you’re new to trading or a seasoned investor, understanding the Double Bottom Pattern can significantly improve your ability to catch market reversals and ride upward trends effectively. This in-depth guide will cover everything you need to know about the Double Bottom Pattern, including its formation, significance, trading strategies, and real-world applications.
What is the Double Bottom Pattern?
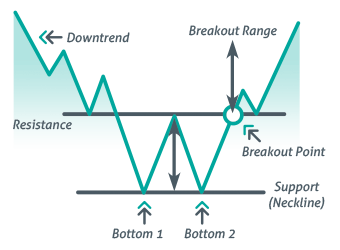
The Double Bottom Pattern is a bullish reversal chart pattern that occurs after a prolonged downtrend. It signals that the asset’s price has found a strong support level and is preparing for a trend reversal to the upside.
Key Characteristics of the Double Bottom Pattern:
- Two Lows at a Similar Level: The price forms two distinct lows at nearly the same level, indicating strong support.
- Neckline Resistance: The highest point between the two lows acts as a resistance level, known as the neckline.
- Breakout Confirmation: A strong breakout above the neckline signals a reversal.
- Volume Expansion: Increased volume during the breakout confirms buying strength.
How to Identify the Double Bottom Pattern
To successfully trade the Double Bottom Pattern, follow these steps to correctly identify it:
- Identify a Downtrend: The pattern must form after a significant downtrend, as it signals a reversal.
- Spot the First Bottom: The price reaches a low point and then rebounds.
- Identify the Second Bottom: After a short-term rally, the price declines again but finds support at a similar level as the first bottom.
- Confirm the Neckline Resistance: The highest price point between the two bottoms serves as the neckline.
- Breakout Above the Neckline: A bullish breakout above the neckline signals the start of an uptrend.
- Check Volume Confirmation: Increased volume during the breakout adds strength to the pattern.
Trading Strategies Using the Double Bottom Pattern
1. Breakout Trading Strategy
- Entry Point: Buy when the price breaks above the neckline.
- Stop-Loss Placement: Set a stop-loss below the second bottom.
- Profit Target: Measure the distance between the neckline and the bottoms and project it upwards from the breakout point.
2. Retest Strategy
- Sometimes, after the initial breakout, the price retests the neckline before continuing higher.
- Enter a trade when the price successfully bounces off the neckline support.
- This strategy reduces the risk of false breakouts.
3. Volume-Based Confirmation Strategy
- A breakout with high volume confirms the strength of the pattern.
- Avoid trading low-volume breakouts, as they can be false signals.
Real-World Examples of the Double Bottom Pattern
Example 1: Apple Inc. (AAPL)
Apple’s stock has formed Double Bottom Patterns multiple times, leading to strong bullish reversals.
Example 2: Bitcoin (BTC/USD)
Bitcoin frequently displays this pattern, signaling major reversals in the cryptocurrency market.
Common Mistakes Traders Make with the Double Bottom Pattern
- Misidentifying the Pattern: Ensure the two bottoms are at similar levels and the neckline is well-defined.
- Ignoring Volume Confirmation: A breakout without volume support may lead to failed trades.
- Entering Too Early: Wait for a clear breakout above resistance before taking a position.
- Setting Stop-Losses Too Tight: Giving the trade some room to breathe prevents premature stop-outs.
Conclusion About The Double Bottom Pattern: A Trader’s Blueprint for Profitable Reversals
The Double Bottom Pattern is one of the most reliable bullish reversal formations, providing traders with high-probability trading opportunities. By correctly identifying the pattern, using volume confirmation, and implementing effective risk management strategies, traders can enhance their profitability.
Whether you trade stocks, forex, or cryptocurrencies, incorporating the Double Bottom Pattern into your trading toolkit can lead to more consistent success in the markets.
Key Takeaways:
- The Double Bottom Pattern signals a bullish trend reversal after a prolonged downtrend.
- The two lows must be at similar levels, and the neckline breakout confirms the pattern.
- Volume confirmation strengthens the reliability of the breakout.
- Proper risk management with stop-loss and profit targets is crucial.
Mastering the Double Bottom Pattern takes practice, but once understood, it can become a valuable weapon in your trading arsenal!
Double Top Pattern: A Trader’s Blueprint for Profitable Reversals
The Ultimate Guide to the Double Top Pattern: A Trader’s Blueprint for Profitable Reversals
Introduction
Among the many chart patterns in technical analysis, the Double Top Pattern stands out as one of the most reliable bearish reversal formations. It helps traders identify potential trend reversals, providing excellent opportunities for profitable trades.
Whether you’re new to trading or a seasoned investor, understanding the Double Top Pattern can significantly improve your ability to catch market reversals and ride downward trends effectively. This in-depth guide will cover everything you need to know about the Double Top Pattern, including its formation, significance, trading strategies, and real-world applications.
What is the Double Top Pattern?
The Double Top Pattern is a bearish reversal chart pattern that occurs after a prolonged uptrend. It signals that the asset’s price has found a strong resistance level and is preparing for a trend reversal to the downside.
Key Characteristics of the Double Top Pattern:
- Two Highs at a Similar Level: The price forms two distinct peaks at nearly the same level, indicating strong resistance.
- Neckline Support: The lowest point between the two highs acts as a support level, known as the neckline.
- Breakout Confirmation: A strong breakout below the neckline signals a reversal.
- Volume Expansion: Increased volume during the breakdown confirms selling strength.
How to Identify the Double Top Pattern
To successfully trade the Double Top Pattern, follow these steps to correctly identify it:
- Identify an Uptrend: The pattern must form after a significant uptrend, as it signals a reversal.
- Spot the First Peak: The price reaches a high point and then declines.
- Identify the Second Peak: After a short-term decline, the price rises again but faces resistance at a similar level as the first peak.
- Confirm the Neckline Support: The lowest price point between the two peaks serves as the neckline.
- Breakout Below the Neckline: A bearish breakdown below the neckline signals the start of a downtrend.
- Check Volume Confirmation: Increased volume during the breakdown adds strength to the pattern.
Trading Strategies Using the Double Top Pattern
1. Breakdown Trading Strategy
- Entry Point: Sell when the price breaks below the neckline.
- Stop-Loss Placement: Set a stop-loss above the second peak.
- Profit Target: Measure the distance between the neckline and the peaks and project it downwards from the breakdown point.
2. Retest Strategy
- Sometimes, after the initial breakdown, the price retests the neckline before continuing lower.
- Enter a trade when the price successfully rejects the neckline resistance.
- This strategy reduces the risk of false breakdowns.
3. Volume-Based Confirmation Strategy
- A breakdown with high volume confirms the strength of the pattern.
- Avoid trading low-volume breakdowns, as they can be false signals.
Real-World Examples of the Double Top Pattern
Example 1: Apple Inc. (AAPL)
Apple’s stock has formed Double Top Patterns multiple times, leading to strong bearish reversals.
Example 2: Bitcoin (BTC/USD)
Bitcoin frequently displays this pattern, signaling major reversals in the cryptocurrency market.
Common Mistakes Traders Make with the Double Top Pattern
- Misidentifying the Pattern: Ensure the two peaks are at similar levels and the neckline is well-defined.
- Ignoring Volume Confirmation: A breakdown without volume support may lead to failed trades.
- Entering Too Early: Wait for a clear breakdown below support before taking a position.
- Setting Stop-Losses Too Tight: Giving the trade some room to breathe prevents premature stop-outs.
Conclusion About The Ultimate Guide to the Double Top Pattern: A Trader’s Blueprint for Profitable Reversals
The Double Top Pattern is one of the most reliable bearish reversal formations, providing traders with high-probability trading opportunities. By correctly identifying the pattern, using volume confirmation, and implementing effective risk management strategies, traders can enhance their profitability.
Whether you trade stocks, forex, or cryptocurrencies, incorporating the Double Top Pattern into your trading toolkit can lead to more consistent success in the markets.
Key Takeaways:
- The Double Top Pattern signals a bearish trend reversal after a prolonged uptrend.
- The two highs must be at similar levels, and the neckline breakdown confirms the pattern.
- Volume confirmation strengthens the reliability of the breakdown.
- Proper risk management with stop-loss and profit targets is crucial.
Mastering the Double Top Pattern takes practice, but once understood, it can become a valuable weapon in your trading arsenal!
Falling Wedge Pattern: A Trader’s Roadmap to Profitable Breakouts
The Ultimate Guide to the Falling Wedge Pattern: A Trader’s Roadmap to Profitable Breakouts
Introduction
Among the most powerful chart patterns in technical analysis, the Falling Wedge Pattern is a bullish formation that signals an impending breakout. Recognizing and trading this pattern effectively can help traders capitalize on price reversals and trend continuations.
Whether you’re a beginner or an experienced trader, mastering the Falling Wedge Pattern can significantly improve your market timing and profitability. In this in-depth guide, we’ll explore everything you need to know about this pattern, from its structure and formation to effective trading strategies and real-world applications.
What is the Falling Wedge Pattern?
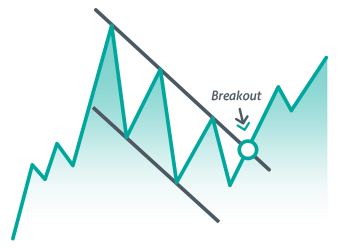
The Falling Wedge Pattern is a bullish continuation or reversal pattern that appears when the price of an asset consolidates within a downward-sloping channel, with the range narrowing over time. It indicates that selling pressure is weakening and that an upward breakout is likely.
Key Characteristics of the Falling Wedge Pattern
- Downward Sloping Trendlines: The price forms lower highs and lower lows, creating a contracting wedge.
- Converging Support and Resistance: The two trendlines converge, signaling a tightening price range.
- Breakout Direction: The breakout usually occurs upward, signaling a bullish move.
- Volume Expansion: The breakout is confirmed with an increase in trading volume.
How to Identify the Falling Wedge Pattern
Spotting the Falling Wedge Pattern correctly is crucial for successful trading. Follow these steps to identify the pattern:
- Identify a Downtrend: The price should be in a downward trend before forming the wedge.
- Draw the Wedge Trendlines: Identify two downward-sloping trendlines that converge over time.
- Monitor Price Compression: The price should oscillate between the trendlines with lower highs and lower lows.
- Breakout Point: A breakout occurs when the price moves above the upper trendline.
- Confirm with Volume: A breakout accompanied by high volume increases the reliability of the pattern.
Trading Strategies Using the Falling Wedge Pattern
1. Breakout Trading Strategy
- Entry Point: Buy when the price breaks above the upper trendline.
- Stop-Loss Placement: Set a stop-loss below the lowest point of the wedge.
- Profit Target: Measure the height of the wedge and project that distance upwards from the breakout point.
2. Retest Strategy
- After the breakout, the price may retest the wedge’s upper trendline before continuing higher.
- Enter a trade when the price successfully bounces off the retest level.
- This strategy reduces the risk of false breakouts.
3. Volume-Based Confirmation Strategy
- A breakout with high volume confirms the strength of the pattern.
- Avoid entering trades on low-volume breakouts, as they can be false signals.
Real-World Examples of the Falling Wedge Pattern
Example 1: Tesla Inc. (TSLA)
Tesla’s stock has shown multiple Falling Wedge Patterns, leading to strong uptrends and profitable breakouts.
Example 2: Bitcoin (BTC/USD)
Cryptocurrencies, including Bitcoin, frequently display this pattern, signaling bullish reversals in the crypto market.
Common Mistakes Traders Make with the Falling Wedge Pattern
- Misidentifying the Pattern: Ensure the wedge slopes downward and the trendlines are converging.
- Ignoring Volume Confirmation: A breakout without volume support may lead to failed trades.
- Entering Too Early: Wait for a clear breakout above resistance before taking a position.
- Setting Stop-Losses Too Tight: Giving the trade some room to breathe prevents premature stop-outs.
Conclusion
The Falling Wedge Pattern is a powerful bullish chart formation that provides traders with high-probability trading opportunities. By correctly identifying the pattern, using volume confirmation, and implementing sound risk management strategies, traders can enhance their profitability.
Whether you trade stocks, forex, or cryptocurrencies, incorporating the Falling Wedge Pattern into your trading strategy can lead to more consistent success in the markets.
Key Takeaways:
- The Falling Wedge Pattern signals a strong bullish breakout after a downtrend.
- The trendlines must converge, and the breakout should be above the upper trendline.
- Breakout confirmation with high volume increases reliability.
- Stop-loss placement and profit targets are essential for risk management.
Mastering the Falling Wedge Pattern takes practice, but once understood, it can become a valuable weapon in your trading arsenal!
Flag Pattern: A Trader’s Secret to Capturing Strong Trends
The Ultimate Guide to the Flag Pattern: A Trader’s Secret to Capturing Strong Trends
Introduction
Among the most effective continuation patterns in technical analysis, the Flag Pattern is a favorite among traders looking to capitalize on powerful trend movements. Recognizing and trading this pattern effectively can help traders ride strong price trends and maximize their profits.
Whether you’re a beginner or an experienced trader, mastering the Flag Pattern can significantly improve your ability to identify market opportunities. In this comprehensive guide, we’ll explore everything you need to know about the Flag Pattern, including its formation, significance, trading strategies, and real-world applications.
What is the Flag Pattern?
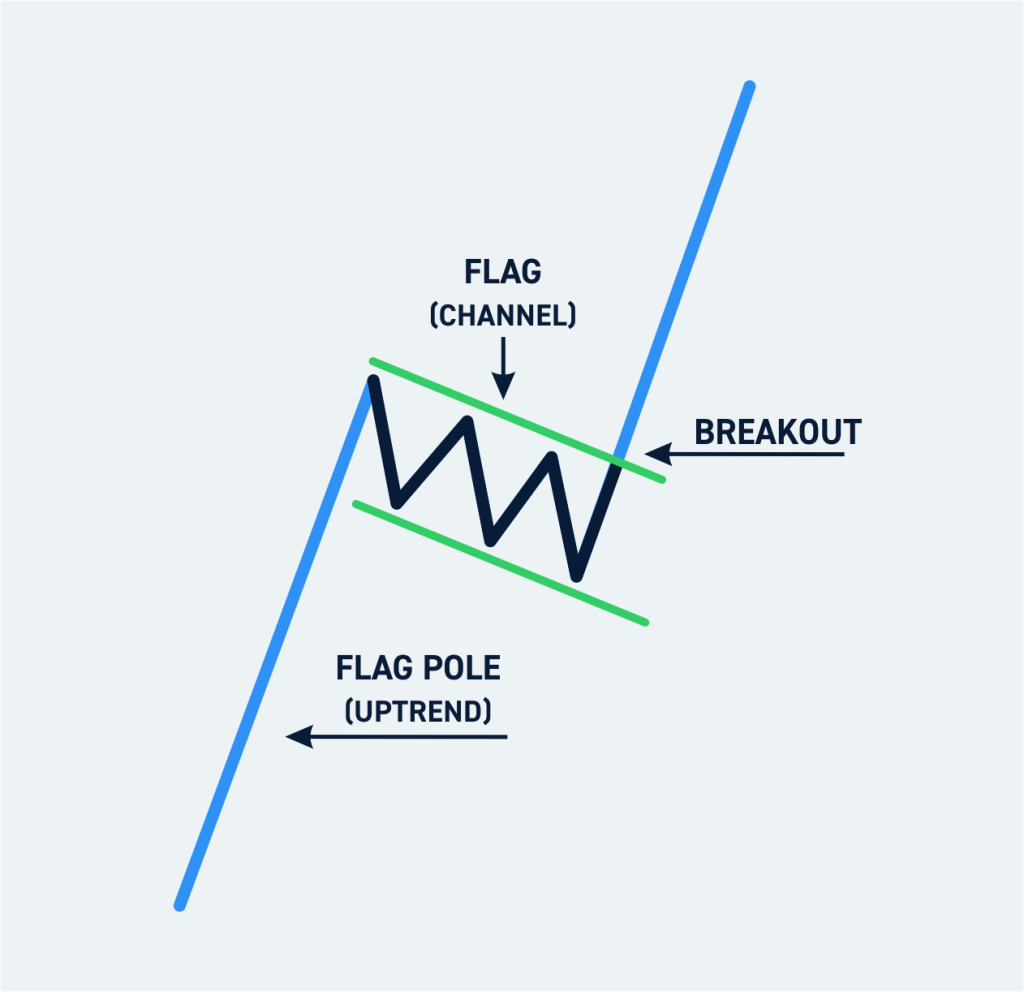
The Flag Pattern is a continuation chart pattern that appears when a sharp price movement (known as the flagpole) is followed by a brief consolidation phase before the trend resumes in the same direction. This pattern indicates a temporary pause in price movement before the asset continues in the prevailing trend.
Key Characteristics of the Flag Pattern:
- Flagpole Formation: A sharp price move, either upward or downward, creates the flagpole.
- Consolidation Phase: Price moves within a small, rectangular range, forming the flag.
- Breakout Direction: The breakout usually occurs in the same direction as the flagpole, confirming trend continuation.
- Volume Confirmation: Volume decreases during consolidation and increases upon breakout.
Types of Flag Patterns
The Flag Pattern comes in two main variations, depending on the prevailing trend:
1. Bullish Flag Pattern
- Occurs in an uptrend.
- The flag slopes downward or moves sideways.
- A breakout above the flag signals the continuation of the uptrend.
2. Bearish Flag Pattern
- Occurs in a downtrend.
- The flag slopes upward or moves sideways.
- A breakdown below the flag signals the continuation of the downtrend.
How to Identify the Flag Pattern
To successfully trade the Flag Pattern, follow these steps to correctly identify it:
- Identify a Strong Trend: Look for a sharp price movement forming the flagpole.
- Spot the Consolidation Phase: Price moves within a narrow, sloping, or sideways range.
- Monitor Volume Behavior: Volume should decline during consolidation and increase on breakout.
- Confirm the Breakout: Wait for the price to move above resistance (bullish flag) or below support (bearish flag).
- Check for Trend Continuation: The breakout should follow the same direction as the initial trend.
Trading Strategies Using the Flag Pattern
1. Breakout Trading Strategy
- Entry Point: Buy (bullish flag) or sell (bearish flag) when the price breaks out of the flag formation.
- Stop-Loss Placement: Set a stop-loss below the flag’s lower boundary (bullish) or above the flag’s upper boundary (bearish).
- Profit Target: Measure the height of the flagpole and project that distance from the breakout point.
2. Retest Strategy
- After breaking out, the price may retest the flag’s boundary before continuing in the trend’s direction.
- Enter a trade when the price successfully bounces off the retest level.
- This strategy reduces the risk of false breakouts.
3. Volume-Based Confirmation Strategy
- A breakout with high volume confirms the strength of the pattern.
- Avoid trading low-volume breakouts, as they can be false signals.
Real-World Examples of the Flag Pattern
Example 1: Apple Inc. (AAPL)
Apple’s stock has displayed Flag Patterns numerous times, leading to strong trend continuations.
Example 2: Bitcoin (BTC/USD)
Bitcoin frequently forms Bullish and Bearish Flag Patterns, indicating trend continuation in the volatile crypto market.
Common Mistakes Traders Make with the Flag Pattern
- Misidentifying the Pattern: Ensure the flagpole is present and consolidation follows before breakout.
- Ignoring Volume Confirmation: A breakout without volume support may lead to failed trades.
- Entering Too Early: Wait for a clear breakout before taking a position.
- Setting Stop-Losses Too Tight: Giving the trade some room to breathe prevents premature stop-outs.
Conclusion
The Flag Pattern is a powerful continuation chart formation that provides traders with high-probability trading opportunities. By correctly identifying the pattern, using volume confirmation, and implementing effective risk management strategies, traders can enhance their profitability.
Whether you trade stocks, forex, or cryptocurrencies, incorporating the Flag Pattern into your trading strategy can lead to more consistent success in the markets.
Key Takeaways:
- The Flag Pattern signals trend continuation after a sharp price movement.
- The flagpole represents strong momentum, and the consolidation phase is a temporary pause.
- Breakout confirmation with high volume increases reliability.
- Stop-loss placement and profit targets are essential for risk management.
Mastering the Flag Pattern takes practice, but once understood, it can become a valuable weapon in your trading arsenal!
Pennant Pattern: A Powerful Tool for Trend Continuation
The Ultimate Guide to the Pennant Pattern: A Powerful Tool for Trend Continuation
Introduction
The Pennant Pattern is one of the most reliable continuation patterns in technical analysis. It helps traders spot short-term consolidation phases before a price surge in the direction of the prevailing trend. Recognizing and effectively trading this pattern can help traders capitalize on strong market movements and maximize their profits.
Whether you are a beginner or an experienced trader, mastering the Pennant Pattern can significantly improve your ability to ride strong trends with confidence. In this comprehensive guide, we’ll explore everything you need to know about the Pennant Pattern, including its structure, significance, trading strategies, and real-world applications.
What is the Pennant Pattern?
The Pennant Pattern is a continuation chart pattern that appears after a strong price movement (known as the flagpole). It signals a brief period of consolidation before the price resumes its original trend.
Key Characteristics of the Pennant Pattern:
- Flagpole Formation: A strong price movement (either bullish or bearish) precedes the pennant.
- Pennant Shape: The consolidation phase forms a small symmetrical triangle with converging trendlines.
- Breakout Direction: The price typically breaks out in the same direction as the flagpole.
- Volume Confirmation: Volume declines during consolidation and spikes on breakout.
Types of Pennant Patterns
The Pennant Pattern comes in two main variations, depending on the prevailing trend:
1. Bullish Pennant Pattern
- Forms in an uptrend.
- The price consolidates within a small, narrowing range.
- A breakout above the pennant signals the continuation of the uptrend.
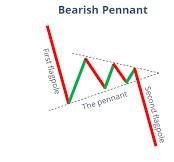
2. Bearish Pennant Pattern
- Forms in a downtrend.
- The price consolidates within a small, narrowing range.
- A breakdown below the pennant signals the continuation of the downtrend.
How to Identify the Pennant Pattern
To successfully trade the Pennant Pattern, follow these steps to correctly identify it:
- Identify a Strong Trend: Look for a sharp price movement that forms the flagpole.
- Spot the Pennant Formation: Price consolidates within a small, symmetrical triangle.
- Monitor Volume Behavior: Volume should decline during consolidation and increase on breakout.
- Confirm the Breakout: Wait for the price to move above resistance (bullish pennant) or below support (bearish pennant).
- Check for Trend Continuation: The breakout should follow the same direction as the initial trend.
Trading Strategies Using the Pennant Pattern
1. Breakout Trading Strategy
- Entry Point: Buy (bullish pennant) or sell (bearish pennant) when the price breaks out of the pennant formation.
- Stop-Loss Placement: Set a stop-loss below the pennant’s lower boundary (bullish) or above the pennant’s upper boundary (bearish).
- Profit Target: Measure the height of the flagpole and project that distance from the breakout point.
2. Retest Strategy
- After breaking out, the price may retest the pennant’s boundary before continuing in the trend’s direction.
- Enter a trade when the price successfully bounces off the retest level.
- This strategy reduces the risk of false breakouts.
3. Volume-Based Confirmation Strategy
- A breakout with high volume confirms the strength of the pattern.
- Avoid trading low-volume breakouts, as they can be false signals.
Real-World Examples of the Pennant Pattern
Example 1: Apple Inc. (AAPL)
Apple’s stock has displayed Pennant Patterns numerous times, leading to strong trend continuations.
Example 2: Bitcoin (BTC/USD)
Bitcoin frequently forms Bullish and Bearish Pennant Patterns, indicating trend continuation in the volatile crypto market.
Common Mistakes Traders Make with the Pennant Pattern
- Misidentifying the Pattern: Ensure the flagpole is present and the pennant forms a symmetrical triangle.
- Ignoring Volume Confirmation: A breakout without volume support may lead to failed trades.
- Entering Too Early: Wait for a clear breakout before taking a position.
- Setting Stop-Losses Too Tight: Giving the trade some room to breathe prevents premature stop-outs.
Conclusion
The Pennant Pattern is a powerful continuation chart formation that provides traders with high-probability trading opportunities. By correctly identifying the pattern, using volume confirmation, and implementing effective risk management strategies, traders can enhance their profitability.
Whether you trade stocks, forex, or cryptocurrencies, incorporating the Pennant Pattern into your trading strategy can lead to more consistent success in the markets.
Key Takeaways:
- The Pennant Pattern signals trend continuation after a strong price movement.
- The flagpole represents strong momentum, and the pennant phase is a temporary pause.
- Breakout confirmation with high volume increases reliability.
- Stop-loss placement and profit targets are essential for risk management.
Mastering the Pennant Pattern takes practice, but once understood, it can become a valuable weapon in your trading arsenal!
Head and Shoulders Top Pattern: A Trader’s Key to Spotting Market Reversals
The Ultimate Guide to the Head and Shoulders Top Pattern: A Trader’s Key to Spotting Market Reversals
Introduction
The Head and Shoulders Top Pattern is one of the most recognizable and powerful reversal patterns in technical analysis. It serves as a clear warning that an asset’s uptrend is losing momentum, potentially leading to a bearish reversal. Traders and investors use this pattern to identify selling opportunities, manage risks, and maximize profits before the market declines.
In this comprehensive guide, we’ll explore everything you need to know about the Head and Shoulders Top Pattern, including its structure, significance, trading strategies, and real-world applications.
What is the Head and Shoulders Top Pattern?
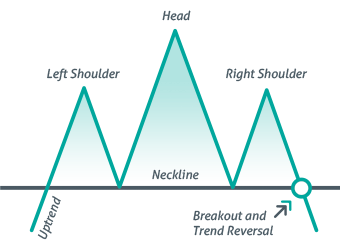
The Head and Shoulders Top Pattern is a bearish reversal pattern that signals a shift from an uptrend to a downtrend. It consists of three peaks:
- Left Shoulder – The price rises, then pulls back, forming the first peak.
- Head – The price surges higher than the left shoulder before declining.
- Right Shoulder – The price rises again but forms a lower high than the head, indicating weakening bullish momentum.
- Neckline – The support level connecting the lows between the shoulders and the head.
When the price breaks below the neckline, it confirms the pattern and signals a bearish trend.
Key Characteristics of the Head and Shoulders Top Pattern
- Occurs after an uptrend – This pattern forms at the peak of an uptrend.
- Three distinct peaks – The head is the highest, with two lower peaks (shoulders) on either side.
- Neckline support level – The breakdown of this level confirms the bearish reversal.
- Volume decline during formation – The pattern typically forms with decreasing volume.
- Breakout with high volume – A breakdown below the neckline with increased volume strengthens the bearish signal.
How to Identify the Head and Shoulders Top Pattern
To successfully trade the Head and Shoulders Top Pattern, follow these steps:
- Look for an uptrend: The pattern only holds significance after a sustained uptrend.
- Spot the three peaks: Identify the left shoulder, head, and right shoulder formation.
- Draw the neckline: Connect the lows between the shoulders and the head.
- Wait for a neckline breakdown: A price drop below the neckline confirms the pattern.
- Confirm with volume: A breakout with increasing volume strengthens the bearish signal.
Trading Strategies Using the Head and Shoulders Top Pattern
1. Breakout Entry Strategy
- Entry Point: Enter a short position when the price breaks below the neckline.
- Stop-Loss Placement: Place a stop-loss above the right shoulder’s high.
- Profit Target: Measure the height from the head to the neckline and project that distance downward.
2. Retest Strategy
- After breaking the neckline, the price may retest the neckline from below before continuing downward.
- Enter a short position when the price fails to reclaim the neckline.
- This strategy helps avoid false breakouts.
3. Volume Confirmation Strategy
- A breakdown with high volume increases reliability.
- Avoid entering trades on low-volume breakdowns, as they may result in failed signals.
Real-World Examples of the Head and Shoulders Top Pattern
Example 1: Amazon Inc. (AMZN)
Amazon’s stock has displayed the Head and Shoulders Top Pattern, leading to major price reversals.
Example 2: Bitcoin (BTC/USD)
Bitcoin has frequently formed Head and Shoulders Top Patterns, signaling trend reversals in the volatile crypto market.
Common Mistakes Traders Make with the Head and Shoulders Top Pattern
- Misidentifying the Pattern: Ensure all three peaks are well-defined with the head being the highest.
- Ignoring Volume Confirmation: A breakdown without volume support may lead to false signals.
- Entering Too Early: Wait for a clear neckline break before taking a short position.
- Placing Stop-Losses Too Tight: Allow some flexibility to avoid premature stop-outs.
Conclusion About The Head and Shoulders Top Pattern: A Trader’s Key to Spotting Market Reversals
The Head and Shoulders Top Pattern is a powerful bearish reversal formation that provides traders with high-probability trading opportunities. By correctly identifying the pattern, using volume confirmation, and implementing sound risk management strategies, traders can enhance their profitability.
Whether you trade stocks, forex, or cryptocurrencies, incorporating the Head and Shoulders Top Pattern into your trading strategy can help you anticipate market reversals and make better trading decisions.
Key Takeaways:
- The Head and Shoulders Top Pattern signals a shift from a bullish trend to a bearish reversal.
- A break below the neckline confirms the pattern and indicates selling pressure.
- Volume confirmation is crucial to avoid false breakouts.
- Stop-loss placement and profit targets are essential for managing risk.
Mastering the Head and Shoulders Top Pattern takes practice, but once understood, it can become a powerful tool in your trading strategy!
Inverse Head and Shoulders Pattern: A Powerful Bullish Reversal Signal
The Ultimate Guide to the Inverse Head and Shoulders Pattern: A Powerful Bullish Reversal Signal
Introduction
The Inverse Head and Shoulders Pattern is one of the most reliable bullish reversal patterns in technical analysis. It signals the transition from a downtrend to an uptrend, providing traders with excellent buying opportunities. Recognizing and trading this pattern effectively can help traders maximize profits and anticipate market reversals.
Whether you’re a beginner or an experienced trader, mastering the Inverse Head and Shoulders Pattern can significantly improve your ability to identify trend reversals and take advantage of bullish momentum. In this comprehensive guide, we’ll explore everything you need to know about the Inverse Head and Shoulders Pattern, including its structure, significance, trading strategies, and real-world applications.
What is the Inverse Head and Shoulders Pattern?
The Inverse Head and Shoulders Pattern is a bullish reversal chart pattern that appears at the end of a downtrend. It consists of three distinct troughs:
- Left Shoulder – The price declines, forms a low, and then rebounds.
- Head – The price drops further, forming the lowest point of the pattern before rising again.
- Right Shoulder – The price declines again but forms a higher low compared to the head, indicating weakening bearish momentum.
- Neckline – The resistance level connecting the peaks between the shoulders and the head.
A breakout above the neckline confirms the pattern and signals the start of a bullish trend.
Key Characteristics of the Inverse Head and Shoulders Pattern
- Occurs after a downtrend – This pattern forms at the bottom of a bearish trend.
- Three distinct troughs – The head is the lowest, with two higher troughs (shoulders) on either side.
- Neckline resistance level – A breakout above this level confirms the bullish reversal.
- Volume decline during formation – The pattern typically forms with decreasing volume.
- Breakout with high volume – A breakout above the neckline with increased volume strengthens the bullish signal.
How to Identify the Inverse Head and Shoulders Pattern
To successfully trade the Inverse Head and Shoulders Pattern, follow these steps:
- Look for a downtrend: The pattern is most effective when it forms after a sustained downtrend.
- Spot the three troughs: Identify the left shoulder, head, and right shoulder formation.
- Draw the neckline: Connect the highs between the shoulders and the head.
- Wait for a neckline breakout: A price rise above the neckline confirms the pattern.
- Confirm with volume: A breakout with increasing volume strengthens the bullish signal.
Trading Strategies Using the Inverse Head and Shoulders Pattern
1. Breakout Entry Strategy
- Entry Point: Enter a long position when the price breaks above the neckline.
- Stop-Loss Placement: Place a stop-loss below the right shoulder’s low.
- Profit Target: Measure the height from the head to the neckline and project that distance upward.
2. Retest Strategy
- After breaking the neckline, the price may retest the neckline from above before continuing upward.
- Enter a long position when the price successfully holds above the neckline.
- This strategy helps avoid false breakouts.
3. Volume Confirmation Strategy
- A breakout with high volume increases reliability.
- Avoid entering trades on low-volume breakouts, as they may result in failed signals.
Real-World Examples of the Inverse Head and Shoulders Pattern
Example 1: Tesla Inc. (TSLA)
Tesla’s stock has displayed Inverse Head and Shoulders Patterns, leading to major bullish trend reversals.
Example 2: Ethereum (ETH/USD)
Ethereum has frequently formed Inverse Head and Shoulders Patterns, signaling upward momentum in the cryptocurrency market.
Common Mistakes Traders Make with the Inverse Head and Shoulders Pattern
- Misidentifying the Pattern: Ensure all three troughs are well-defined, with the head being the lowest.
- Ignoring Volume Confirmation: A breakout without volume support may lead to false signals.
- Entering Too Early: Wait for a clear neckline break before taking a long position.
- Placing Stop-Losses Too Tight: Allow some flexibility to avoid premature stop-outs.
Conclusion About The Inverse Head and Shoulders Pattern: A Powerful Bullish Reversal Signal
The Inverse Head and Shoulders Pattern is a powerful bullish reversal formation that provides traders with high-probability buying opportunities. By correctly identifying the pattern, using volume confirmation, and implementing sound risk management strategies, traders can enhance their profitability.
Whether you trade stocks, forex, or cryptocurrencies, incorporating the Inverse Head and Shoulders Pattern into your trading strategy can help you anticipate market reversals and make better trading decisions.
Key Takeaways:
- The Inverse Head and Shoulders Pattern signals a shift from a bearish trend to a bullish reversal.
- A break above the neckline confirms the pattern and indicates buying pressure.
- Volume confirmation is crucial to avoid false breakouts.
- Stop-loss placement and profit targets are essential for managing risk.
Mastering the Inverse Head and Shoulders Pattern takes practice, but once understood, it can become a powerful tool in your trading strategy!
Rounding Bottom Pattern: A Powerful Bullish Reversal Signal
The Ultimate Guide to the Rounding Bottom Pattern: A Powerful Bullish Reversal Signal
Introduction
The Rounding Bottom Pattern is a well-known bullish reversal pattern that signals the gradual transition from a downtrend to an uptrend. Traders and investors use this pattern to identify long-term buying opportunities, as it often leads to significant price appreciation when confirmed.
Mastering the Rounding Bottom Pattern can help you anticipate market reversals, maximize profits, and improve your overall trading strategy. In this comprehensive guide, we’ll explore the structure, significance, trading strategies, and real-world applications of the Rounding Bottom Pattern to help you make more informed trading decisions.
What is the Rounding Bottom Pattern?
The Rounding Bottom Pattern is a bullish reversal chart pattern that typically forms over a long period, signifying a gradual shift from bearish sentiment to bullish momentum. It resembles a “U” shape, indicating that the market is slowly stabilizing before breaking out into a strong uptrend.
Key Characteristics:
- Occurs after a prolonged downtrend – Signals the end of bearish pressure.
- Smooth and rounded price movement – Unlike sharp reversals, this pattern forms gradually.
- Volume decreases during formation – Selling pressure weakens as buyers gain control.
- Breakout above resistance – A breakout above the resistance level confirms the pattern.
- Longer formation period – Can take weeks, months, or even years to develop.
The Rounding Bottom Pattern is often seen in stocks, forex, and cryptocurrencies, making it a valuable tool for traders across different markets.
How to Identify the Rounding Bottom Pattern
To successfully trade the Rounding Bottom Pattern, follow these key steps:
- Identify the downtrend: Look for a sustained price decline before the rounding bottom forms.
- Spot the gradual curve: The price should start stabilizing, forming a smooth U-shaped structure.
- Observe volume behavior: Volume typically declines during the formation and increases near the breakout.
- Find the resistance level: The highest point before the decline acts as a key resistance level.
- Wait for the breakout: A price move above resistance confirms the pattern and signals a buying opportunity.
Trading Strategies Using the Rounding Bottom Pattern
1. Breakout Entry Strategy
- Entry Point: Enter a long position when the price breaks above the resistance level.
- Stop-Loss Placement: Place a stop-loss below the lowest point of the pattern.
- Profit Target: Measure the height from the lowest point to the resistance level and project that distance upward.
2. Pullback Strategy
- Sometimes, after the breakout, the price retests the resistance-turned-support before continuing higher.
- Enter a long position if the price successfully holds above the breakout level.
- This strategy helps avoid false breakouts.
3. Volume Confirmation Strategy
- A breakout with high volume strengthens the bullish signal.
- Avoid entering trades on low-volume breakouts, as they may result in failed signals.
Real-World Examples of the Rounding Bottom Pattern
Example 1: Apple Inc. (AAPL)
Apple’s stock has displayed Rounding Bottom Patterns, leading to major trend reversals and long-term price appreciation.
Example 2: Bitcoin (BTC/USD)
Bitcoin has frequently formed Rounding Bottom Patterns, signaling strong bullish momentum after prolonged price declines.
Common Mistakes Traders Make with the Rounding Bottom Pattern
- Misidentifying the Pattern: Ensure the price movement forms a smooth and gradual curve.
- Ignoring Volume Confirmation: A breakout without volume support may lead to false signals.
- Entering Too Early: Wait for a clear breakout above resistance before taking a long position.
- Placing Stop-Losses Too Tight: Allow some flexibility to avoid premature stop-outs.
Conclusion
The Rounding Bottom Pattern is a powerful bullish reversal formation that provides traders with high-probability buying opportunities. By correctly identifying the pattern, using volume confirmation, and implementing sound risk management strategies, traders can capitalize on long-term price movements.
Whether you trade stocks, forex, or cryptocurrencies, incorporating the Rounding Bottom Pattern into your trading strategy can help you identify major trend reversals and make better trading decisions.
Key Takeaways:
- The Rounding Bottom Pattern signals a shift from a bearish trend to a bullish reversal.
- A break above resistance confirms the pattern and indicates buying pressure.
- Volume confirmation is crucial to avoid false breakouts.
- Stop-loss placement and profit targets are essential for managing risk.
Mastering the Rounding Bottom Pattern takes patience, but once understood, it can become a valuable tool in your trading arsenal!
Price Channel Pattern: A Trader’s Roadmap to Market Trends
The Ultimate Guide to the Price Channel Pattern: A Trader’s Roadmap to Market Trends
Introduction
The Price Channel Pattern is one of the most effective technical analysis tools used by traders to identify trends, anticipate breakouts, and execute profitable trades. This pattern helps traders understand support and resistance levels, allowing them to make informed trading decisions in both bullish and bearish markets.
Understanding how to identify and trade the Price Channel Pattern can significantly improve your market timing and overall trading strategy. In this comprehensive guide, we’ll explore the structure, significance, trading strategies, and real-world applications of the Price Channel Pattern, equipping you with actionable insights to boost your trading success.
What is the Price Channel Pattern?
The Price Channel Pattern is a continuation pattern formed by two parallel trendlines that contain price movements within a specific range. The upper trendline represents resistance, while the lower trendline represents support. Prices fluctuate within this channel until a breakout occurs, signaling a potential trend reversal or continuation.
Key Characteristics:
- Two parallel trendlines – One acts as resistance, and the other acts as support.
- Consistent price movement – Prices oscillate within the defined range.
- Works in uptrends, downtrends, and sideways markets.
- Breakout signals a potential new trend direction.
- Volume analysis enhances breakout confirmation.
The Price Channel Pattern is commonly observed in stocks, forex, and cryptocurrency markets, making it an essential tool for technical traders.
Types of Price Channel Patterns
The Price Channel Pattern can form in three distinct ways:
1. Ascending Price Channel (Bullish Channel)
- Formed when price moves upward within two parallel trendlines.
- The lower trendline acts as support, and the upper trendline acts as resistance.
- Traders look for buying opportunities near the support line and breakouts above resistance.
2. Descending Price Channel (Bearish Channel)
- Formed when price moves downward within two parallel trendlines.
- The upper trendline acts as resistance, and the lower trendline acts as support.
- Traders look for short-selling opportunities near resistance and breakouts below support.
3. Horizontal Price Channel (Sideways Channel)
- Occurs when price moves sideways within two horizontal lines.
- Indicates a period of consolidation before a potential breakout.
- Traders wait for a breakout above resistance or below support to determine the next trend direction.
How to Identify the Price Channel Pattern
To effectively trade the Price Channel Pattern, follow these steps:
- Identify the trend direction: Determine whether the market is in an uptrend, downtrend, or sideways movement.
- Draw parallel trendlines: Connect the highs and lows of price action to form the channel.
- Observe price movement within the channel: Prices should consistently bounce between support and resistance.
- Watch for breakout signals: A price move above resistance or below support signals a potential new trend.
- Confirm with volume: A breakout with increased volume strengthens the trade signal.
Trading Strategies Using the Price Channel Pattern
1. Buying at Support and Selling at Resistance
- Buy near the lower trendline (support) in an ascending or sideways price channel.
- Sell near the upper trendline (resistance) to take profits before a potential reversal.
- Works well in range-bound markets where breakouts are less frequent.
2. Breakout Entry Strategy
- Enter a trade when the price breaks out of the channel with strong volume.
- Stop-Loss Placement: Set a stop-loss just outside the opposite trendline.
- Profit Target: Measure the height of the channel and project it beyond the breakout point.
3. Retest Confirmation Strategy
- Wait for price to retest the broken channel line before entering a trade.
- This strategy helps avoid false breakouts and increases trade accuracy.
- Works best in volatile markets where breakouts often retest prior levels before continuing.
Real-World Examples of the Price Channel Pattern
Example 1: Amazon Inc. (AMZN)
Amazon’s stock frequently forms Price Channel Patterns, providing traders with clear trend-following opportunities.
Example 2: Bitcoin (BTC/USD)
Bitcoin often moves within Price Channels, offering traders opportunities to buy at support and sell at resistance before major breakouts occur.
Common Mistakes Traders Make with the Price Channel Pattern
- Forcing Trendlines: Ensure trendlines are drawn based on valid price action and not just forced to fit.
- Ignoring Volume Confirmation: A breakout without volume support may lead to false signals.
- Entering Trades Too Early: Wait for clear breakout confirmation before making a trade.
- Placing Stop-Losses Too Tight: Allow some flexibility to avoid premature stop-outs.
Conclusion About The Price Channel Pattern: A Trader’s Roadmap to Market Trends
The Price Channel Pattern is a powerful tool for identifying trend direction, support and resistance levels, and breakout opportunities. By correctly identifying and trading this pattern, traders can improve their market analysis and enhance their profitability.
Whether you trade stocks, forex, or cryptocurrencies, incorporating the Price Channel Pattern into your trading strategy can help you capture trends, anticipate breakouts, and make informed trading decisions.
Key Takeaways:
- The Price Channel Pattern helps traders identify trends and trade within predictable ranges.
- A breakout above resistance or below support signals a potential trend shift.
- Volume confirmation is crucial to avoid false breakouts.
- Stop-loss placement and profit targets are essential for managing risk.
Mastering the Price Channel Pattern takes practice, but once understood, it can become an indispensable tool in your trading arsenal!
Triple Top Reversal Pattern: A Powerful Bearish Signal
The Ultimate Guide to the Triple Top Reversal Pattern: A Powerful Bearish Signal
Introduction
The Triple Top Reversal Pattern is a significant bearish reversal chart pattern that signals the end of an uptrend and the potential for a strong downtrend. This pattern is commonly used by traders and investors to identify selling opportunities and minimize risk before a major price decline occurs.
Mastering the Triple Top Reversal Pattern can help you anticipate market reversals, maximize profits, and improve your overall trading strategy. In this comprehensive guide, we’ll explore the structure, significance, trading strategies, and real-world applications of the Triple Top Reversal Pattern to help you make more informed trading decisions.
What is the Triple Top Reversal Pattern?
The Triple Top Reversal Pattern is a bearish reversal pattern that forms after an extended uptrend. It consists of three peaks at roughly the same price level, separated by pullbacks, followed by a decisive breakdown below the support level.
Key Characteristics:
- Occurs after a prolonged uptrend – Signals the exhaustion of buying momentum.
- Three distinct peaks at similar levels – Indicates strong resistance.
- Volume decreases with each peak – Shows weakening buying interest.
- Breaks below the support line – Confirms the bearish reversal.
- Formation takes time – Can develop over weeks or months.
This pattern appears in stocks, forex, cryptocurrencies, and commodities, making it a valuable tool for traders across various markets.
How to Identify the Triple Top Reversal Pattern
To successfully trade the Triple Top Reversal Pattern, follow these key steps:
- Identify an Uptrend: Look for a prolonged bullish trend before the pattern forms.
- Spot Three Peaks at Resistance: The price should fail to break above the same resistance level three times.
- Observe Volume Behavior: Volume should decrease with each peak, signaling weakening buying pressure.
- Confirm the Support Level: Identify the key support level connecting the lows between the peaks.
- Wait for a Breakdown: A price move below the support line confirms the pattern and signals a strong sell opportunity.
Trading Strategies Using the Triple Top Reversal Pattern
1. Breakout Entry Strategy
- Entry Point: Enter a short position when the price breaks below the support level.
- Stop-Loss Placement: Place a stop-loss above the third peak to minimize risk.
- Profit Target: Measure the height from the peaks to the support level and project that distance downward.
2. Retest Strategy
- After breaking the support line, the price may retest the support-turned-resistance before continuing downward.
- Enter a short position if the price fails to reclaim the support level.
- Helps avoid false breakouts and increases trade accuracy.
3. Volume Confirmation Strategy
- A breakdown with high volume strengthens the bearish signal.
- Avoid entering trades on low-volume breakouts, as they may result in false signals.
Real-World Examples of the Triple Top Reversal Pattern
Example 1: Tesla Inc. (TSLA)
Tesla’s stock has exhibited Triple Top Reversal Patterns, leading to major downtrends and sell-offs.
Example 2: Ethereum (ETH/USD)
Ethereum has formed Triple Top Reversals, signaling strong bearish momentum after failing to break key resistance levels.
Common Mistakes Traders Make with the Triple Top Reversal Pattern
- Misidentifying the Pattern: Ensure the three peaks are distinct and evenly spaced.
- Ignoring Volume Confirmation: A breakdown without volume support may lead to false signals.
- Entering Too Early: Wait for a clear breakout below support before taking a short position.
- Placing Stop-Losses Too Tight: Allow some flexibility to avoid premature stop-outs.
Conclusion About The Triple Top Reversal Pattern: A Powerful Bearish Signal
The Triple Top Reversal Pattern is a powerful bearish reversal formation that provides traders with high-probability selling opportunities. By correctly identifying the pattern, using volume confirmation, and implementing sound risk management strategies, traders can capitalize on downtrend movements.
Whether you trade stocks, forex, or cryptocurrencies, incorporating the Triple Top Reversal Pattern into your trading strategy can help you identify major trend reversals and make better trading decisions.
Key Takeaways:
- The Triple Top Reversal Pattern signals the end of an uptrend and the start of a downtrend.
- A break below support confirms the pattern and indicates strong selling pressure.
- Volume confirmation is crucial to avoid false breakouts.
- Stop-loss placement and profit targets are essential for managing risk.
Mastering the Triple Top Reversal Pattern takes practice, but once understood, it can become a valuable tool in your trading arsenal!
Triple Bottom Reversal Pattern: A Bullish Trend Reversal Signal
The Ultimate Guide to the Triple Bottom Reversal Pattern: A Bullish Trend Reversal Signal
Introduction
The Triple Bottom Reversal Pattern is a powerful bullish reversal chart pattern that signals the end of a downtrend and the beginning of a new uptrend. This pattern helps traders and investors identify buying opportunities and make informed decisions before a significant price increase occurs.
Understanding and correctly identifying the Triple Bottom Reversal Pattern can help traders maximize profits, reduce risk, and improve overall trading performance. In this comprehensive guide, we’ll explore the structure, significance, trading strategies, and real-world applications of the Triple Bottom Reversal Pattern to help you incorporate it into your trading strategy.
What is the Triple Bottom Reversal Pattern?
The Triple Bottom Reversal Pattern is a bullish reversal pattern that forms after an extended downtrend. It consists of three lows at approximately the same price level, separated by small rebounds, followed by a decisive breakout above the resistance level.
Key Characteristics:
- Occurs after a prolonged downtrend – Signals the exhaustion of selling pressure.
- Three distinct lows at similar levels – Indicates strong support.
- Volume increases with each bounce – Shows growing buying interest.
- Breakout above the resistance line – Confirms the bullish reversal.
- Formation takes time – Can develop over weeks or months.
This pattern is commonly found in stocks, forex, cryptocurrencies, and commodities, making it a valuable tool for traders in various markets.
How to Identify the Triple Bottom Reversal Pattern
To successfully trade the Triple Bottom Reversal Pattern, follow these key steps:
- Identify a Downtrend: The pattern must form after a prolonged bearish trend.
- Spot Three Lows at Support: The price should fail to break below the same support level three times.
- Observe Volume Behavior: Volume should increase with each bounce, signaling growing buying pressure.
- Confirm the Resistance Level: Identify the key resistance level connecting the highs between the lows.
- Wait for a Breakout: A price move above the resistance level confirms the pattern and signals a strong buying opportunity.
Trading Strategies Using the Triple Bottom Reversal Pattern
1. Breakout Entry Strategy
- Entry Point: Enter a long position when the price breaks above the resistance level.
- Stop-Loss Placement: Place a stop-loss below the third low to minimize risk.
- Profit Target: Measure the height from the lows to the resistance level and project that distance upward.
2. Retest Strategy
- After breaking the resistance line, the price may retest the resistance-turned-support before continuing upward.
- Enter a long position if the price successfully holds above the new support level.
- Helps avoid false breakouts and increases trade accuracy.
3. Volume Confirmation Strategy
- A breakout with high volume strengthens the bullish signal.
- Avoid entering trades on low-volume breakouts, as they may result in false signals.
Real-World Examples of the Triple Bottom Reversal Pattern
Example 1: Apple Inc. (AAPL)
Apple’s stock has formed Triple Bottom Reversal Patterns, leading to major uptrends and strong buying opportunities.
Example 2: Bitcoin (BTC/USD)
Bitcoin has exhibited Triple Bottom Reversal Patterns, signaling strong bullish momentum after holding key support levels multiple times.
Common Mistakes Traders Make with the Triple Bottom Reversal Pattern
- Misidentifying the Pattern: Ensure the three lows are distinct and evenly spaced.
- Ignoring Volume Confirmation: A breakout without volume support may lead to false signals.
- Entering Too Early: Wait for a clear breakout above resistance before taking a long position.
- Placing Stop-Losses Too Tight: Allow some flexibility to avoid premature stop-outs.
Conclusion
The Triple Bottom Reversal Pattern is a powerful bullish reversal formation that provides traders with high-probability buying opportunities. By correctly identifying the pattern, using volume confirmation, and implementing sound risk management strategies, traders can capitalize on upward market movements.
Whether you trade stocks, forex, or cryptocurrencies, incorporating the Triple Bottom Reversal Pattern into your trading strategy can help you identify major trend reversals and make better trading decisions.
Key Takeaways:
- The Triple Bottom Reversal Pattern signals the end of a downtrend and the start of an uptrend.
- A break above resistance confirms the pattern and indicates strong buying pressure.
- Volume confirmation is crucial to avoid false breakouts.
- Stop-loss placement and profit targets are essential for managing risk.
Mastering the Triple Bottom Reversal Pattern takes practice, but once understood, it can become a valuable tool in your trading arsenal!
Bullish Flag Pattern: A Strong Continuation Signal
The Ultimate Guide to the Bullish Flag Pattern: A Strong Continuation Signal
Introduction
The Bullish Flag Pattern is one of the most powerful and reliable continuation patterns in technical analysis. It signals a temporary consolidation before the price resumes its strong upward movement. This pattern is widely used by traders in stocks, forex, commodities, and cryptocurrencies to identify potential breakout opportunities and maximize profits.
Mastering the Bullish Flag Pattern can help traders take advantage of trend continuation, improve trade accuracy, and enhance overall trading performance. In this in-depth guide, we’ll explore the structure, significance, trading strategies, and real-world examples of the Bullish Flag Pattern to help you incorporate it into your trading arsenal.
What is the Bullish Flag Pattern?
The Bullish Flag Pattern is a continuation pattern that appears after a strong uptrend. It consists of two key parts:
- Flagpole – A sharp price increase (strong upward move) due to heavy buying pressure.
- Flag – A small downward or sideways consolidation, forming a rectangular shape that slopes slightly downward.
After the consolidation phase, the price breaks out above the flag’s resistance and resumes the uptrend.
Key Characteristics:
- Forms after a strong uptrend – Indicates bullish momentum.
- Parallel or downward-sloping flag – A temporary consolidation.
- Breakout above resistance – Confirms the continuation of the trend.
- Volume spikes during breakout – Strengthens the bullish confirmation.
- Works across different timeframes – Suitable for day trading and long-term investing.
How to Identify the Bullish Flag Pattern
To effectively trade the Bullish Flag Pattern, follow these steps:
- Look for a Strong Uptrend: The flag should form after a significant bullish move.
- Identify the Flagpole: The initial price surge should be steep and well-defined.
- Observe the Flag Formation: The price should consolidate in a small, downward-sloping or sideways range.
- Confirm Volume Behavior: Volume should decline during the flag formation and increase during the breakout.
- Wait for a Breakout: A price move above the flag’s resistance confirms the pattern and signals a buying opportunity.
Trading Strategies Using the Bullish Flag Pattern
1. Breakout Entry Strategy
- Entry Point: Enter a long position when the price breaks above the flag’s resistance.
- Stop-Loss Placement: Place a stop-loss below the flag’s support to minimize risk.
- Profit Target: Measure the height of the flagpole and project that distance upward.
2. Pullback Strategy
- Sometimes, after a breakout, the price retests the flag’s resistance-turned-support.
- Enter a trade if the retest holds and bullish momentum resumes.
- This strategy helps avoid false breakouts.
3. Volume Confirmation Strategy
- A breakout with high volume provides a stronger confirmation.
- Avoid trading low-volume breakouts, as they may be false signals.
Real-World Examples of the Bullish Flag Pattern
Example 1: Amazon Inc. (AMZN)
Amazon’s stock has exhibited Bullish Flag Patterns, leading to strong breakouts and further price appreciation.
Example 2: Bitcoin (BTC/USD)
Bitcoin has formed Bullish Flags before making explosive moves to new highs, confirming trend continuation.
Common Mistakes Traders Make with the Bullish Flag Pattern
- Misidentifying the Pattern: Ensure the consolidation looks like a flag, not a reversal pattern.
- Ignoring Volume Confirmation: Low volume breakouts can lead to false signals.
- Entering Too Early: Wait for a clear breakout before entering a trade.
- Placing Stop-Losses Too Tight: Allow flexibility to avoid premature stop-outs.
Conclusion
The Bullish Flag Pattern is a highly effective trend continuation formation that offers traders high-probability buying opportunities. By correctly identifying the pattern, using volume confirmation, and implementing sound risk management strategies, traders can capitalize on strong uptrend movements.
Whether you trade stocks, forex, or cryptocurrencies, incorporating the Bullish Flag Pattern into your strategy can help you identify powerful trend continuations and make better trading decisions.
Key Takeaways:
- The Bullish Flag Pattern signals trend continuation in an uptrend.
- A breakout above resistance confirms the pattern and indicates strong bullish momentum.
- Volume confirmation is crucial to avoid false breakouts.
- Stop-loss placement and profit targets are essential for managing risk.
Mastering the Bullish Flag Pattern takes practice, but once understood, it can become a valuable tool in your trading strategy!
Bearish Flag Pattern: A Powerful Continuation Signal
The Ultimate Guide to the Bearish Flag Pattern: A Powerful Continuation Signal
Introduction
The Bearish Flag Pattern is one of the most reliable continuation patterns in technical analysis, signaling a temporary pause before the price continues its downward movement. This pattern is widely used by traders in stocks, forex, commodities, and cryptocurrencies to identify potential shorting opportunities and maximize profits in a bearish trend.
Mastering the Bearish Flag Pattern can help traders capitalize on downtrend continuation, improve trade accuracy, and enhance overall trading performance. In this comprehensive guide, we’ll explore the structure, significance, trading strategies, and real-world examples of the Bearish Flag Pattern to help you incorporate it into your trading strategy.
What is the Bearish Flag Pattern?
The Bearish Flag Pattern is a continuation pattern that appears after a strong downtrend. It consists of two key components:
- Flagpole – A sharp price decrease due to strong selling pressure.
- Flag – A small upward or sideways consolidation, forming a rectangular shape that slopes slightly upward.
After the consolidation phase, the price breaks down below the flag’s support and resumes the downtrend.
Key Characteristics:
- Forms after a strong downtrend – Indicates bearish momentum.
- Parallel or upward-sloping flag – A temporary consolidation.
- Breakdown below support – Confirms the continuation of the trend.
- Volume spikes during breakdown – Strengthens the bearish confirmation.
- Works across different timeframes – Suitable for day trading and long-term investing.
How to Identify the Bearish Flag Pattern
To effectively trade the Bearish Flag Pattern, follow these steps:
- Look for a Strong Downtrend: The flag should form after a significant bearish move.
- Identify the Flagpole: The initial price drop should be steep and well-defined.
- Observe the Flag Formation: The price should consolidate in a small, upward-sloping or sideways range.
- Confirm Volume Behavior: Volume should decline during the flag formation and increase during the breakdown.
- Wait for a Breakdown: A price move below the flag’s support confirms the pattern and signals a selling opportunity.
Trading Strategies Using the Bearish Flag Pattern
1. Breakdown Entry Strategy
- Entry Point: Enter a short position when the price breaks below the flag’s support.
- Stop-Loss Placement: Place a stop-loss above the flag’s resistance to minimize risk.
- Profit Target: Measure the height of the flagpole and project that distance downward.
2. Pullback Strategy
- Sometimes, after a breakdown, the price retests the flag’s support-turned-resistance.
- Enter a trade if the retest holds and bearish momentum resumes.
- This strategy helps avoid false breakouts.
3. Volume Confirmation Strategy
- A breakdown with high volume provides a stronger confirmation.
- Avoid trading low-volume breakdowns, as they may be false signals.
Real-World Examples of the Bearish Flag Pattern
Example 1: Tesla Inc. (TSLA)
Tesla’s stock has exhibited Bearish Flag Patterns, leading to strong breakdowns and further price declines.
Example 2: Ethereum (ETH/USD)
Ethereum has formed Bearish Flags before making significant downward moves, confirming trend continuation.
Common Mistakes Traders Make with the Bearish Flag Pattern
- Misidentifying the Pattern: Ensure the consolidation looks like a flag, not a reversal pattern.
- Ignoring Volume Confirmation: Low volume breakdowns can lead to false signals.
- Entering Too Early: Wait for a clear breakdown before entering a trade.
- Placing Stop-Losses Too Tight: Allow flexibility to avoid premature stop-outs.
Conclusion About The Bearish Flag Pattern: A Powerful Continuation Signal
The Bearish Flag Pattern is a highly effective trend continuation formation that offers traders high-probability shorting opportunities. By correctly identifying the pattern, using volume confirmation, and implementing sound risk management strategies, traders can capitalize on strong downtrend movements.
Whether you trade stocks, forex, or cryptocurrencies, incorporating the Bearish Flag Pattern into your strategy can help you identify powerful trend continuations and make better trading decisions.
Key Takeaways:
- The Bearish Flag Pattern signals trend continuation in a downtrend.
- A breakdown below support confirms the pattern and indicates strong bearish momentum.
- Volume confirmation is crucial to avoid false breakdowns.
- Stop-loss placement and profit targets are essential for managing risk.
Mastering the Bearish Flag Pattern takes practice, but once understood, it can become a valuable tool in your trading strategy!