WILL MAKE YOU A SUCCESSFUL STOCK MARKET TRADER IN 30 DAYS.
Chart patterns For
INTRADAY TRADING | SWING TRADING
SCALPING TRADING |LONG TERM TRADING
JOIN WITH US | LEARN - EARN - SUCCESS
CALL NOW : +91 - 94-94-64-15-85

Chart Patterns identification in Stock Market Course Trading Training in Master's Academy Ameerpet, Hyderabad Telangana.
Mastering Chart Patterns: A Comprehensive Guide for Traders and Investors
Chart patterns have long been one of the most crucial tools used by traders and investors in analyzing financial markets. Whether you’re a seasoned professional or just getting started, understanding chart patterns is key to interpreting market movements and making informed decisions. In this guide, we’ll delve deep into chart patterns, what they are, how to recognize them, and why they are so important in trading.
What Are Chart Patterns?
At its core, chart patterns are graphical representations of price movements over time. These patterns are created by plotting the price of an asset on a chart, typically using candlesticks, lines, or bars. Traders and investors look at these patterns to predict future price movements based on past market behavior.
Chart patterns can be divided into two broad categories:
- Reversal Patterns: These signal a potential change in the current trend, either from a bullish (uptrend) to a bearish (downtrend) or vice versa.
- Continuation Patterns: These suggest that the current trend is likely to continue after a brief period of consolidation or indecision.
Recognizing these patterns allows traders to anticipate market movements and make decisions based on the probability of specific outcomes.
The Importance of Chart Patterns in Trading
Chart patterns are not foolproof, but they have a high success rate when used correctly. Here’s why they are so essential:
- Predicting Market Movements: By studying historical price data, chart patterns can give insights into future price directions.
- Managing Risk: Identifying chart patterns helps traders understand potential risks. This enables them to set stop-loss orders and manage their trades more effectively.
- Understanding Market Psychology: Chart patterns reflect collective market sentiment. Recognizing these patterns gives traders a psychological edge, as they can tap into the emotions driving market behavior.
Commonly Used Chart Patterns
There are dozens of chart patterns used by traders, but the most well-known and widely used include:
1. Head and Shoulders
The Head and Shoulders pattern is one of the most reliable reversal patterns. It signals a potential reversal from an uptrend to a downtrend. It consists of three peaks:
- The first peak is the left shoulder.
- The second, higher peak is the head.
- The third peak is the right shoulder, which is lower than the head but similar in height to the left shoulder.
Once the price breaks below the neckline (a support line drawn connecting the lows), the trend is considered reversed, and traders may enter a short position.
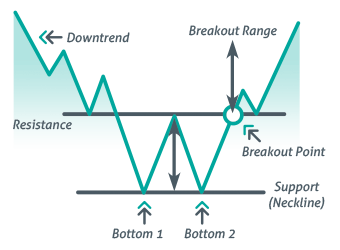
2. Double Top and Double Bottom
The Double Top and Double Bottom are both reversal patterns. A Double Top is a bearish pattern that occurs after an uptrend and signals a potential trend reversal. The price forms two peaks at roughly the same level, followed by a break below the support level between the peaks.
Conversely, the Double Bottom is a bullish pattern that signals the end of a downtrend. It forms two troughs at nearly the same level, followed by a break above the resistance level between the troughs.
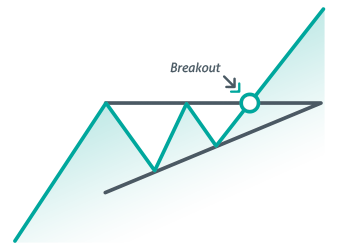
3. Triangles
Triangle patterns are continuation patterns that indicate periods of consolidation before the market breaks out in either direction. There are three types of triangles:
- Symmetrical Triangle: This pattern is formed when the price converges between rising support and falling resistance lines. The breakout can occur in either direction.
- Ascending Triangle: This pattern is characterized by a flat top resistance and rising support. It is typically a bullish continuation pattern.
- Descending Triangle: This pattern is characterized by a flat bottom support and falling resistance. It is typically a bearish continuation pattern.
4. Flags and Pennants
Flags and Pennants are short-term continuation patterns that typically form after a sharp price movement, followed by a brief consolidation before the trend resumes.
- Flag Pattern: The flag is a small rectangular-shaped consolidation area that slopes against the prevailing trend.
- Pennant Pattern: The pennant is a small symmetrical triangle that forms after a sharp price movement.
Both patterns usually indicate that the prior trend is likely to continue once the price breaks out of the consolidation range.
5. Cup and Handle
The Cup and Handle is a bullish continuation pattern that looks like the shape of a teacup. It starts with a rounded bottom (the cup), followed by a slight pullback (the handle), and then a breakout to the upside. This pattern typically signals that a stock will continue its upward trend after a period of consolidation.
How to Use Chart Patterns for Trading
Understanding and recognizing chart patterns is only the first step. To successfully use them for trading, here are a few tips to consider:
1. Confirm with Volume
Volume plays an essential role in validating chart patterns. For example, a breakout from a pattern is often more reliable when it is accompanied by higher-than-average volume. A lack of volume during a breakout can signal that the price move may not be sustainable.
2. Use Other Technical Indicators
While chart patterns are powerful tools, they work best when used alongside other technical indicators such as Moving Averages, RSI (Relative Strength Index), MACD (Moving Average Convergence Divergence), and Bollinger Bands. These indicators help confirm the strength and direction of the trend.
3. Understand the Market Context
Chart patterns should be analyzed in the context of the broader market. For instance, a Head and Shoulders pattern might have more significance if the broader market is showing signs of weakness. Understanding macroeconomic factors and news events is also crucial when interpreting chart patterns.
4. Risk Management
Even the best traders don’t win every trade. Risk management is key when using chart patterns. Set stop-loss orders at logical levels based on the pattern you are trading, and always calculate your risk-to-reward ratio before entering a trade.
The Role of Chart Patterns in Day Trading vs. Long-Term Investing
The relevance of chart patterns differs depending on your trading style:
- Day Traders: For day traders, chart patterns are essential for identifying quick price movements and entry/exit points within a single trading day. They focus on short-term patterns such as flags, pennants, and triangles.
- Long-Term Investors: For investors holding positions over weeks, months, or even years, chart patterns can help in identifying major trend changes. Reversal patterns such as the Head and Shoulders or Double Bottoms are more significant for long-term investors who want to capture larger price moves.
Common Mistakes to Avoid When Trading Chart Patterns
Chart pattern analysis is not foolproof, and there are common mistakes traders make that can reduce their chances of success. Some of these include:
- Ignoring Trend Direction: Entering trades against the dominant trend can be risky. Always ensure the overall market sentiment aligns with the pattern.
- Premature Entry: Entering a trade before the pattern is fully confirmed can lead to false breakouts. Wait for confirmation before acting.
- Overtrading: Trying to trade every pattern that forms can lead to losses. Focus on high-quality setups with strong risk-reward ratios.
Conclusion
Chart patterns are an indispensable tool for traders and investors, offering valuable insights into market sentiment and potential future price movements. By understanding the most common chart patterns and applying them with a sound risk management strategy, you can improve your trading performance and increase your chances of success.
Remember, while chart patterns can be incredibly useful, they should be used in conjunction with other technical indicators and an understanding of the broader market context. Practice and experience will help you recognize high-quality chart patterns and enhance your trading strategy over time.
By honing your ability to interpret chart patterns, you can unlock a deeper understanding of market behavior and improve your trading skills. Whether you’re day trading or investing for the long term, chart patterns remain one of the most effective tools for navigating the complexities of financial markets

17 Stock Chart Patterns Every Stock Market Traders Should Know
Ascending Triangle Pattern

Symmetrical Triangle Pattern

Descending Triangle Pattern