
YOU WANT TO BECOME A SUCCESSFUL STOCK MARKET TRADER ? IF YES ! WE ARE THE GUARANTEE FOR YOUR SUCCESS.
WILL MAKE YOU A SUCCESSFUL STOCK MARKET TRADER IN 30 DAYS.
JOIN WITH US | LEARN - EARN - SUCCESS
A SUCCESSFUL STOCK MARKETER ONLY CAN EARN THE MONEY IN STOCK MARKET WITHOUT FAIL, SO WE ARE THE GUARANTEE FOR YOUR SUCCESS.
CALL NOW : +91 - 94-94-64-15-85

Stock Market Trading Course Training in Hyderabad
Master’s Academy Stock Market Trading Course Training in Hyderabad
Introduction
Stock Market Trading Course Training in Hyderabad. Stock market trading has become an essential skill for those looking to achieve financial independence. With the right knowledge, strategies, and risk management techniques, anyone can navigate the stock market successfully. If you’re in Hyderabad and looking for a structured learning path, Master’s Academy Stock Market Trading Course Training in Hyderabad is your go-to option.
Master’s Academy is a premier institute dedicated to training aspiring traders and investors. With expert faculty, practical market exposure, and in-depth course content, this academy ensures that students gain a deep understanding of the financial markets. Whether you are a beginner or an experienced trader, enrolling in a professional course can significantly enhance your trading skills and profitability.
Why Choose Master’s Academy for Stock Market Training?
1. Comprehensive Course Structure
Master’s Academy offers a well-structured curriculum covering all aspects of stock trading. From basic market concepts to advanced trading strategies, the training program is designed to cater to traders of all levels.
2. Experienced Mentors and Faculty
Learn from market experts who have years of trading and investment experience. The faculty at Master’s Academy guides students through both theoretical concepts and practical trading scenarios.
3. Live Market Training
A significant part of the learning process involves real-time market exposure. Students participate in live trading sessions to apply their theoretical knowledge in a practical setting.
4. Customized Learning Modules
Master’s Academy offers tailor-made courses based on student requirements. Whether you’re interested in intraday trading, swing trading, options trading, or long-term investing, you can choose a specialized course that suits your needs.
5. Risk Management & Psychology Training
Trading success is not just about strategies but also about risk management and psychological discipline. The course covers essential aspects such as controlling emotions, handling losses, and executing trades with confidence.
What You Will Learn in Master’s Academy Stock Market Trading Course
The Master’s Academy Stock Market Trading Course Training in Hyderabad covers a range of topics that provide a solid foundation for trading success. Below are some of the key modules included in the course:
1. Introduction to Stock Markets
Basics of financial markets
Understanding stock exchanges (NSE & BSE)
Market participants and their roles
2. Technical Analysis
Price action and candlestick patterns
Support and resistance levels
Moving Averages, RSI, MACD, Bollinger Bands
Trend analysis and breakout strategies
3. Fundamental Analysis
Understanding company financial statements
Analyzing balance sheets, P&L statements
Macroeconomic factors affecting stock prices
4. Trading Strategies
Intraday trading techniques
Swing trading and positional trading strategies
Options and futures trading fundamentals
5. Risk Management & Psychology
Stop-loss and take-profit strategies
Position sizing and risk-reward ratio
Handling emotions in trading
6. Live Market Training
Placing real trades under expert guidance
Understanding order execution
Reading market trends and making informed decisions
Who Should Enroll in This Course?
The Master’s Academy Stock Market Trading Course Training in Hyderabad is ideal for:
Beginners looking to enter the stock market
Professionals who want to enhance their trading skills
Investors aiming to maximize returns
Traders looking to develop consistent strategies
Benefits of Learning at Master’s Academy
1. Practical Hands-On Experience
Unlike traditional courses that focus solely on theory, Master’s Academy emphasizes live market training, ensuring that students gain real-world experience.
2. Personalized Mentorship
Get one-on-one guidance from seasoned traders who help refine your trading strategies and risk management techniques.
3. Affordable Course Fees
The academy offers cost-effective training programs that provide value for money without compromising on quality.
4. Flexible Learning Options
Both offline and online training options are available, making it convenient for students from different backgrounds to learn at their own pace.
Why Hyderabad is an Ideal Place for Stock Market Training?
Hyderabad has emerged as a financial hub, with a growing community of traders and investors. The city provides an excellent ecosystem for learning stock market trading due to:
Presence of Top Stock Market Institutes
Growing Number of Trading Communities
Access to Leading Brokerage Firms and Financial Institutions
Opportunities to Network with Like-Minded Traders
Conclusion About The Master’s Academy Stock Market Trading Course Training in Hyderabad
Stock market trading is an art and a science that requires continuous learning and practice. Enrolling in Master’s Academy Stock Market Trading Course Training in Hyderabad will give you the right tools, knowledge, and confidence to trade profitably. With expert mentorship, live market training, and a structured course, you can achieve your financial goals in the stock market.
Start your journey toward stock market success today with Master’s Academy and take the first step in mastering trading strategies that work!
Uptrend in Stock Market
Uptrend in Stock Market: A Comprehensive Guide for Traders and Investors
The stock market moves in trends, and one of the most sought-after patterns is an uptrend. But what is an uptrend in the stock market, and why is it crucial for traders and investors? In this in-depth guide, we will explore the concept of an uptrend, its characteristics, how to identify it, and strategies to capitalize on it effectively.
What is an Uptrend in Stock Market?
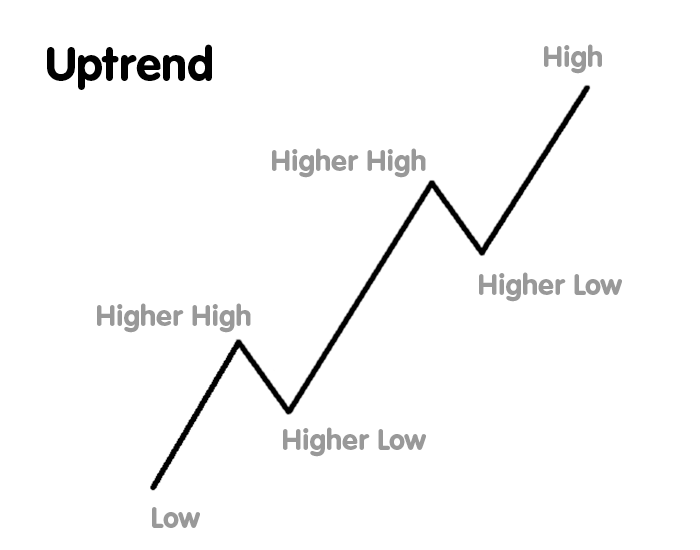
An uptrend in the stock market refers to a continuous increase in the price of a stock, index, or asset over a specific period. It is characterized by higher highs and higher lows, indicating strong buying momentum. Investors and traders look for uptrends to capitalize on price appreciation and generate profits.
Key Features of an Uptrend
Higher Highs: The stock price reaches new peaks over time.
Higher Lows: The price does not fall below previous low points, showing continued bullish sentiment.
Increased Buying Pressure: More investors are willing to buy, pushing the price up.
Sustained Demand: Strong fundamentals or market sentiment drive the asset higher.
Support Levels Hold Strong: The price bounces off support zones, confirming the trend’s strength.
Why is an Uptrend Important?
1. Profit Opportunities
Investors and traders seek uptrends to maximize their gains. Buying in an uptrend increases the chances of profiting from rising prices.
2. Strong Market Sentiment
An uptrend reflects positive investor sentiment, optimism about the stock, or overall market health.
3. Long-Term Growth
For long-term investors, identifying stocks in a sustained uptrend can lead to wealth accumulation and capital appreciation.
4. Reduced Downside Risk
Since uptrends follow a pattern of higher lows, they offer some level of protection against sudden market downturns.
How to Identify an Uptrend in Stock Market
1. Trendlines and Chart Patterns
Draw a trendline connecting the higher lows to confirm the uptrend.
Upward-sloping trendlines indicate a strong bullish market.
2. Moving Averages
50-day and 200-day Moving Averages: If the stock price remains above these averages, it confirms an uptrend.
Golden Cross: When the 50-day moving average crosses above the 200-day moving average, it signals a strong uptrend.
3. Volume Analysis
An uptrend with increasing volume confirms strong buying interest.
Declining volume may indicate weakness in the trend.
4. Relative Strength Index (RSI)
An RSI above 50 supports an uptrend.
RSI in the 60-70 range indicates strong momentum, but above 70 may signal overbought conditions.
5. Breakout from Resistance Levels
If the stock price breaks above a resistance level with high volume, it suggests the continuation of an uptrend.
Different Phases of an Uptrend
Accumulation Phase: Smart investors start buying stocks at lower prices, gradually pushing them higher.
Markup Phase: The trend gains momentum, and more traders join the rally.
Distribution Phase: The price reaches a peak, and some investors start taking profits.
Decline or Reversal Phase: If the uptrend weakens, the price may enter a downtrend.
Trading Strategies to Capitalize on an Uptrend
1. Buy on Dips
During an uptrend, small pullbacks offer great buying opportunities. Look for support levels to enter new positions.
2. Trend Following Strategy
Use moving averages and trendlines to ride the trend.
Hold positions until the trend shows signs of reversal.
3. Breakout Trading
Buy when the price breaks above a resistance level with strong volume.
Set stop-loss levels below recent support levels.
4. Trailing Stop Loss
Use a trailing stop to lock in profits while allowing room for price fluctuations.
Adjust stop-loss levels as the trend progresses.
Uptrend in Different Market Conditions
1. Bull Market Uptrend
When the overall market is bullish, most stocks exhibit strong uptrends.
Investors focus on growth stocks and high-performing sectors.
2. Sector-Specific Uptrend
Some sectors outperform others, even in neutral or bearish markets.
Identifying strong sectors helps traders focus on winning stocks.
3. Post-Correction Uptrend
After a market correction, stocks that show resilience and regain momentum may enter a new uptrend.
These stocks often offer great long-term investment opportunities.
Risks Associated with an Uptrend
1. Trend Reversal Risk
An uptrend can reverse due to external factors like economic downturns or negative company news.
2. Overbought Conditions
Stocks in strong uptrends may become overvalued, leading to sudden pullbacks.
RSI above 70 or excessive speculation signals potential corrections.
3. False Breakouts
Some uptrends may experience false breakouts, trapping traders who buy too early.
Confirm breakouts with volume and other indicators.
How to Protect Your Investments in an Uptrend
1. Set Stop-Loss Orders
A stop-loss prevents significant losses in case of sudden trend reversals.
2. Diversification
Avoid putting all your capital into one stock or sector. Spread investments across different industries.
3. Monitor Market Trends
Stay updated on economic indicators, corporate earnings, and news events that may impact the uptrend.
Conclusion About The Uptrend in Stock Market
An uptrend in the stock market represents a favorable condition for traders and investors looking to capitalize on rising prices. Understanding how to identify an uptrend, confirming it with technical indicators, and using effective trading strategies can help you maximize profits. However, risk management is essential to protect gains and avoid losses from sudden reversals.
By incorporating trend analysis, volume confirmation, and stop-loss strategies, you can confidently navigate the market and take advantage of uptrends for long-term financial success.
Downtrend in Stock Market
Downtrend in Stock Market: A Comprehensive Guide for Traders and Investors
The stock market moves in trends, and one of the most concerning patterns for traders and investors is a downtrend. But what is a downtrend in the stock market, and how can you navigate it effectively? In this detailed guide, we will explore the concept of a downtrend, its characteristics, how to identify it, and strategies to manage risk and capitalize on it.
What is a Downtrend in Stock Market?
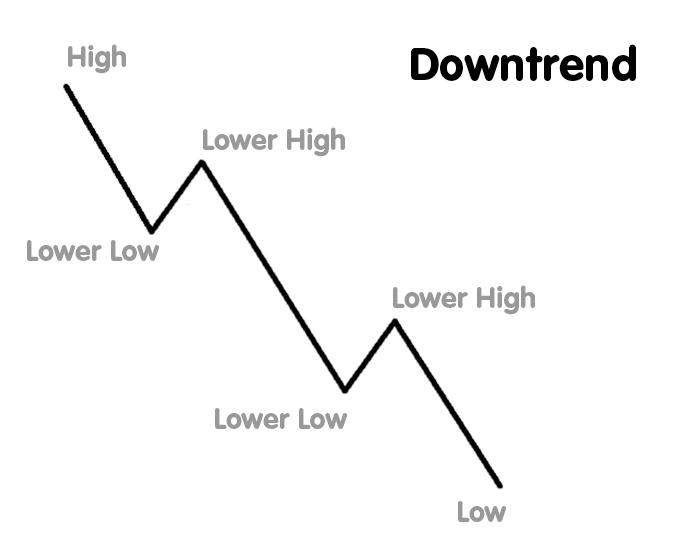
A downtrend in the stock market refers to a continuous decrease in the price of a stock, index, or asset over a specific period. It is characterized by lower highs and lower lows, indicating strong selling momentum. Investors and traders must recognize downtrends early to minimize losses or even profit from falling prices.
Key Features of a Downtrend
- Lower Highs: The stock price fails to reach previous peaks.
- Lower Lows: The price continues to decline beyond previous low points.
- Increased Selling Pressure: More investors are selling, pushing the price down.
- Weak Market Sentiment: Negative news or poor fundamentals drive the asset lower.
- Resistance Levels Hold Strong: The price struggles to break above key resistance zones, confirming the downtrend.
Why is a Downtrend Important?
1. Risk Management
Recognizing a downtrend early helps investors protect their portfolios from heavy losses.
2. Short-Selling Opportunities
Traders can take advantage of downtrends by short-selling stocks or using derivative instruments like options and futures.
3. Market Sentiment Indicator
A prolonged downtrend may indicate broader economic weaknesses, helping investors make informed decisions.
4. Long-Term Investment Decisions
Understanding downtrends allows long-term investors to identify market bottoms and buy stocks at discounted prices.
How to Identify a Downtrend in Stock Market
1. Trendlines and Chart Patterns
- Draw a trendline connecting the lower highs to confirm the downtrend.
- Downward-sloping trendlines indicate strong bearish momentum.
2. Moving Averages
- 50-day and 200-day Moving Averages: If the stock price remains below these averages, it confirms a downtrend.
- Death Cross: When the 50-day moving average crosses below the 200-day moving average, it signals a strong downtrend.
3. Volume Analysis
- A downtrend with increasing volume confirms strong selling interest.
- Declining volume may indicate a weakening trend.
4. Relative Strength Index (RSI)
- An RSI below 50 supports a downtrend.
- RSI in the 30-40 range indicates strong bearish momentum, but below 30 may signal oversold conditions.
5. Breakdown from Support Levels
- If the stock price breaks below a support level with high volume, it suggests the continuation of a downtrend.
Different Phases of a Downtrend
- Distribution Phase: Smart investors start selling stocks at high prices before the decline begins.
- Decline Phase: The trend gains momentum, and panic selling intensifies.
- Capitulation Phase: Investors lose hope, leading to a sharp sell-off.
- Accumulation Phase: Smart investors start buying at low prices, preparing for a future uptrend.
Trading Strategies to Manage a Downtrend
1. Stop-Loss Strategy
Setting stop-loss orders helps traders exit positions before losses become significant.
2. Short Selling
- Traders sell stocks at higher prices and buy them back at lower prices to profit from the decline.
- Requires margin accounts and careful risk management.
3. Put Options Strategy
- Buying put options allows traders to profit from falling prices with limited risk.
4. Hedging with Safe Assets
- Moving funds into gold, bonds, or defensive stocks can reduce portfolio losses.
Downtrend in Different Market Conditions
1. Bear Market Downtrend
- A prolonged downtrend in the overall market, often due to economic downturns or crises.
2. Sector-Specific Downtrend
- Some sectors decline while others remain stable, allowing traders to rotate investments.
3. Post-Rally Downtrend
- After a strong bull run, stocks may enter a corrective downtrend before stabilizing.
Risks Associated with a Downtrend
1. Capital Loss
- Holding stocks during a downtrend can result in significant losses.
2. Panic Selling
- Emotional trading decisions often lead to selling at the worst possible time.
3. False Reversals
- Some downtrends experience temporary recoveries before resuming their decline.
How to Protect Your Investments in a Downtrend
1. Diversification
- Spreading investments across different assets reduces risk.
2. Defensive Stocks and Safe-Haven Assets
- Investing in sectors like healthcare, utilities, and consumer staples can provide stability.
3. Monitoring Market Trends
- Stay updated on economic indicators, corporate earnings, and global events.
Conclusion About The Down Trend in Stock Market
A downtrend in the stock market signals declining prices and bearish sentiment. Understanding how to identify and navigate downtrends is essential for investors and traders to protect their capital and seize profit opportunities. By incorporating trend analysis, volume confirmation, stop-loss strategies, and defensive investing, you can minimize risks and make informed financial decisions.
Uptrend And Downtrend in Stock Market
Gap Up Opening in Stock Market
Gap Up Opening in Stock Market: A Comprehensive Guide for Traders and Investors
The stock market is full of surprises, and one of the most exciting movements traders witness is a gap up opening. But what is a gap up opening in the stock market, and why does it matter? In this in-depth guide, we’ll explore the concept of gap up openings, their causes, types, trading strategies, and how investors can take advantage of them.
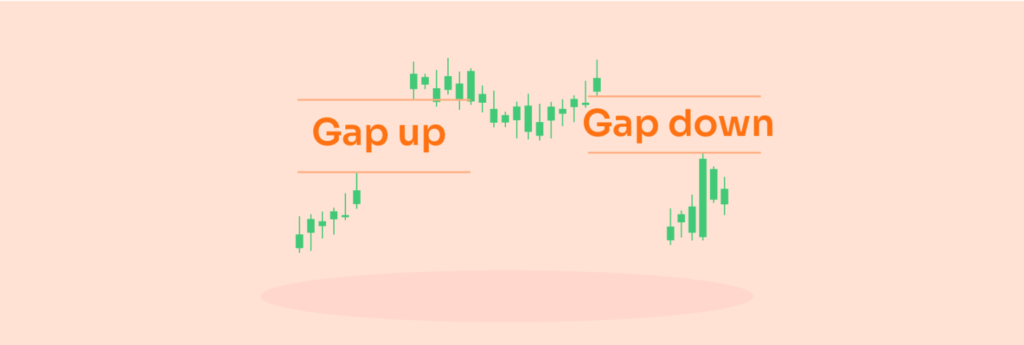
What is a Gap Up Opening in Stock Market?
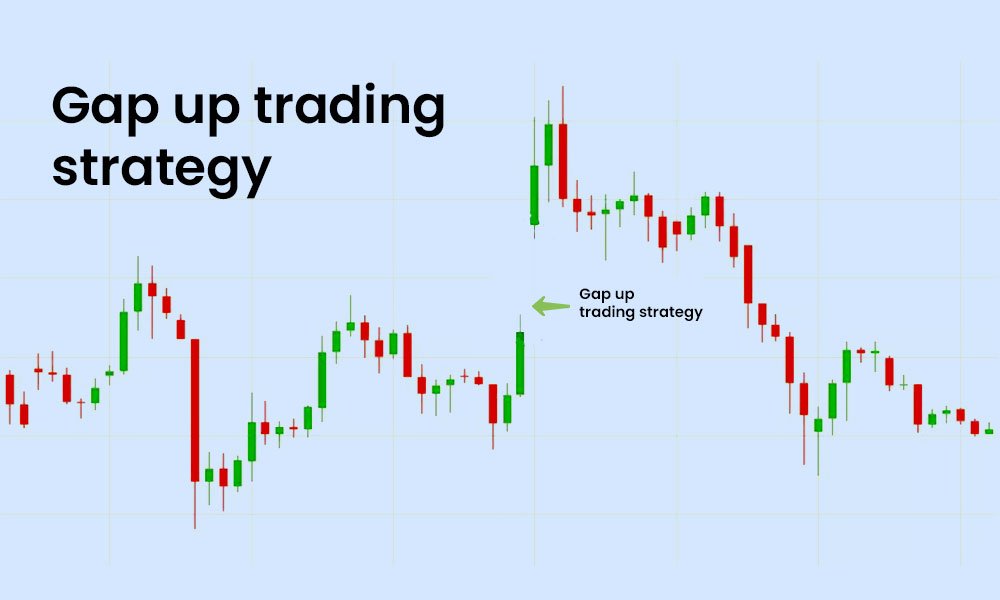
A gap up opening in the stock market occurs when the opening price of a stock is significantly higher than its previous day’s closing price. This creates a visible gap on the stock chart, indicating a surge in demand for the stock. Gap ups often signal strong bullish sentiment, but traders need to analyze them carefully before making decisions.
Key Features of a Gap Up Opening
- Higher Opening Price: The stock opens above the previous closing price, forming a price gap.
- Increased Buying Interest: Investors show strong demand, leading to a surge in prices.
- Positive Market Sentiment: Often triggered by favorable news, earnings reports, or global market trends.
- High Trading Volume: Gap ups are usually accompanied by increased volume, confirming the move’s strength.
- Volatility: Prices may fluctuate rapidly after a gap up, creating opportunities for traders.
Why Does a Gap Up Opening Happen?
Several factors contribute to a gap up opening in the stock market:
1. Positive Earnings Reports
Strong quarterly earnings or revenue growth can drive investor confidence, leading to a gap up opening.
2. Breaking News and Announcements
Major corporate developments like mergers, acquisitions, or new product launches can push stock prices higher.
3. Global Market Influence
A rally in international markets can trigger a gap up in local stocks, especially those with global exposure.
4. Strong Economic Data
Positive GDP growth, employment numbers, or inflation reports can lead to optimism and higher stock prices.
5. Upgrades by Analysts
If prominent analysts upgrade a stock’s rating or price target, it can attract buyers, causing a gap up.
6. Short Covering
If a heavily shorted stock gets unexpected positive news, short sellers rush to buy back shares, leading to a gap up.
Types of Gap Up Openings
Understanding the different types of gap ups can help traders decide their approach:
1. Common Gap
- Occurs due to normal market movements and typically fills quickly.
- Example: A stock gaps up slightly due to minor news but retraces within the day.
2. Breakaway Gap
- Happens when a stock breaks out of a price range or pattern with strong volume.
- Example: A stock that was consolidating in a range suddenly breaks above resistance with a large gap up.
3. Runaway Gap (Continuation Gap)
- Occurs in an already established uptrend, confirming continued bullish momentum.
- Example: A stock already trending higher gaps up further due to growing demand.
4. Exhaustion Gap
- Happens near the end of a trend and can indicate a reversal.
- Example: A stock gaps up after a prolonged rally but then starts declining, showing signs of profit-taking.
How to Trade a Gap Up Opening
1. Wait for Confirmation
- Avoid impulsive trades immediately after a gap up.
- Watch price action for signs of continuation or reversal.
2. Use Technical Indicators
- Volume Analysis: High volume confirms a strong move, while low volume may indicate a false breakout.
- Moving Averages: If the stock stays above key moving averages, the uptrend is likely to continue.
- Relative Strength Index (RSI): An RSI above 70 may indicate overbought conditions, leading to a potential pullback.
3. Set Stop Loss Levels
- Place a stop loss below the gap to protect against sudden reversals.
- Adjust stop-loss levels based on market conditions.
4. Trade with Market Sentiment
- Analyze overall market trends before taking positions.
- If broader indices are strong, gap ups are more likely to sustain.
5. Gap Fill Strategy
- Some gap ups tend to retrace and fill the gap before resuming an uptrend.
- Traders can short the stock if there’s weakness, expecting a gap fill.
Risks Associated with a Gap Up Opening
1. False Breakouts
- Some gap ups fail to hold gains and quickly reverse, leading to losses for traders who enter too early.
2. Profit Booking
- Large investors may use a gap up as an opportunity to sell shares, causing price declines.
3. Market Overreaction
- Sometimes, news-driven gaps are exaggerated and later correct themselves.
4. Increased Volatility
- Gap ups often lead to high volatility, making it difficult to manage risk effectively.
Strategies for Long-Term Investors
1. Assess the Fundamentals
- Ensure that the gap up is driven by strong fundamentals, not speculation.
2. Look for Growth Stocks
- Companies with consistent earnings growth and innovation often sustain their gains after a gap up.
3. Avoid Chasing Stocks
- If a stock has already surged significantly, wait for a pullback before entering.
4. Diversify Investments
- Spread your investments across different sectors to manage risk effectively.
Gap Up Opening in Different Market Conditions
1. Bull Market Gap Up
- More likely to hold gains and continue rising.
- Traders focus on strong momentum stocks.
2. Bear Market Gap Up
- May fade quickly due to underlying weakness.
- Traders should be cautious and confirm trends.
3. Sector-Specific Gap Up
- Certain industries may experience gap ups due to sector-wide positive news.
Conclusion About The Gap Up Opening in Stock Market
A gap up opening in the stock market is an exciting event that signals strong buying interest. While it presents lucrative trading opportunities, it also comes with risks. Understanding the reasons behind a gap up, identifying the type of gap, and using effective trading strategies can help traders and investors make informed decisions.
By focusing on technical indicators, market sentiment, and risk management, you can navigate gap ups successfully and take advantage of bullish market moves. Whether you’re a day trader looking for quick profits or a long-term investor seeking sustainable growth, mastering gap up openings can improve your overall market strategy.
Gap Down Opening in Stock Market
Gap Down Opening in Stock Market: A Complete Guide for Traders and Investors
The stock market is full of price fluctuations, and one of the most concerning patterns for traders and investors is a gap down opening. But what is a gap down opening in the stock market, and how does it affect market sentiment and trading strategies? In this detailed guide, we’ll explore the concept of a gap down opening, its causes, different types, trading strategies, and how investors can mitigate risks or even benefit from it.
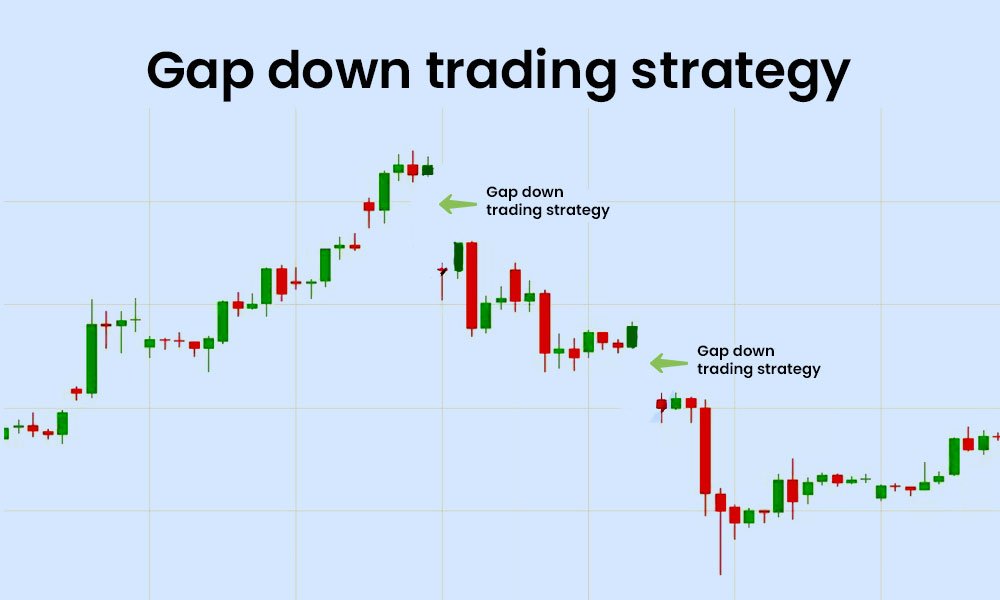
What is a Gap Down Opening in Stock Market?
A gap down opening in the stock market occurs when a stock’s opening price is significantly lower than its previous day’s closing price. This creates a visible gap on the stock chart, indicating strong selling pressure or negative market sentiment. A gap down can be triggered by various factors, including poor earnings reports, negative global cues, economic downturns, or unexpected bad news.
Key Features of a Gap Down Opening
- Lower Opening Price: The stock opens below the previous closing price, forming a downward price gap.
- Increased Selling Pressure: A sudden surge in selling leads to lower stock prices.
- Bearish Market Sentiment: Negative news or weak fundamentals can cause panic selling.
- High Volatility: The stock experiences wild price swings after a gap down.
- Breakdown of Support Levels: If the gap down breaks a crucial support level, further declines may follow.
Why Does a Gap Down Opening Happen?
Several factors contribute to a gap down opening in the stock market:
1. Disappointing Earnings Reports
A company reporting lower-than-expected revenue or profits can lead to investor disappointment and a sharp decline in its stock price.
2. Negative Economic Data
Unfavorable macroeconomic indicators such as high inflation, weak GDP growth, or rising unemployment can trigger gap downs.
3. Global Market Trends
If international markets experience a sell-off due to geopolitical tensions, economic concerns, or other factors, local stock markets may follow with a gap down opening.
4. Company-Specific Negative News
Bad news such as fraud allegations, lawsuits, or management scandals can cause investors to panic and sell their holdings, leading to a gap down.
5. Downgrades by Analysts
If major analysts downgrade a stock due to weak financials or poor business outlook, it can trigger selling pressure.
6. Profit Booking After a Rally
Stocks that have witnessed a strong rally may experience profit-taking, leading to a gap down opening.
Types of Gap Down Openings
Understanding different types of gap downs helps traders identify potential trading opportunities:
1. Common Gap
- Occurs due to normal market fluctuations.
- Usually fills quickly as buying interest returns.
2. Breakaway Gap
- Happens when a stock breaks below a key support level with high volume.
- Signals a strong downtrend and potential further declines.
3. Runaway Gap (Continuation Gap)
- Occurs in an ongoing downtrend, confirming further bearish momentum.
- Often leads to continued declines in stock price.
4. Exhaustion Gap
- Happens near the end of a downtrend.
- Indicates that selling pressure may be slowing down and a reversal might occur.
How to Trade a Gap Down Opening
1. Wait for Market Confirmation
- Avoid making impulsive trades immediately after a gap down.
- Observe whether the price stabilizes or continues to decline.
2. Use Technical Indicators
- Volume Analysis: High volume during a gap down confirms strong selling pressure.
- Moving Averages: If a stock trades below key moving averages, it signals a strong downtrend.
- Relative Strength Index (RSI): An RSI below 30 may indicate oversold conditions, leading to a potential reversal.
3. Short Selling Opportunities
- Traders can short stocks that experience a gap down and show continued weakness.
- Requires careful risk management and stop-loss placement.
4. Gap Fill Strategy
- Some gap downs tend to fill the gap later in the session.
- Traders can go long if there are signs of recovery after a significant sell-off.
5. Set Stop-Loss Levels
- Place stop losses above the gap to protect against sudden reversals.
- Adjust stop-loss levels based on market conditions.
Risks Associated with a Gap Down Opening
1. False Breakdowns
- Some gap downs may recover quickly, leading to false bearish signals.
2. Panic Selling
- Investors who react emotionally may sell at the worst possible time.
3. High Volatility
- Prices may fluctuate wildly after a gap down, making it difficult to predict market direction.
4. Bear Traps
- Sometimes, a stock gaps down but quickly reverses upward, trapping short-sellers.
Strategies for Long-Term Investors
1. Assess Company Fundamentals
- Ensure that the gap down is not due to long-term business weakness.
2. Look for Value Buying Opportunities
- Stocks with strong fundamentals that gap down due to temporary factors may present good buying opportunities.
3. Avoid Buying Too Early
- If a stock gaps down significantly, wait for stability before making a long-term investment decision.
4. Diversify Your Portfolio
- Spread investments across different sectors to minimize risk.
Gap Down Opening in Different Market Conditions
1. Bear Market Gap Down
- More likely to continue declining due to weak sentiment.
- Traders should focus on short-selling strategies.
2. Bull Market Gap Down
- Often presents buying opportunities as strong stocks recover quickly.
3. Sector-Specific Gap Down
- Some industries may face downturns while others remain stable.
- Investors should analyze sector trends before making decisions.
Conclusion About The Gap Down Opening in the Stock Market
A gap down opening in the stock market indicates strong selling pressure and bearish sentiment. While it can create panic among investors, it also presents trading opportunities for those who understand market behavior. Recognizing the types of gap downs, using technical analysis, and implementing sound risk management strategies can help traders and investors navigate these market movements effectively.
Whether you are a day trader looking for short-term opportunities or a long-term investor seeking value stocks at lower prices, mastering gap down openings can improve your decision-making process and risk management strategies in the stock market.
Gap Up And Gap Down Trading Strategies in Stock Market :
Sideways Market in the Stock Market
Sideways Market in the Stock Market: A Comprehensive Guide for Traders and Investors
The stock market is dynamic, moving through different phases of uptrends, downtrends, and periods of consolidation. One of the most confusing yet crucial phases to understand is the sideways market in the stock market. Many traders struggle to navigate this phase, as prices remain stagnant, moving within a tight range. But what does a sideways market indicate, and how can traders take advantage of it?
In this detailed guide, we’ll explore what a sideways market in the stock market is, why it happens, key characteristics, trading strategies, and how investors can make the most out of this market phase.
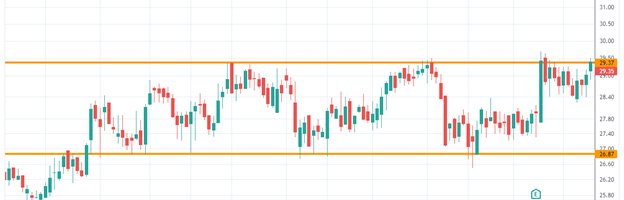
What is a Sideways Market in the Stock Market?
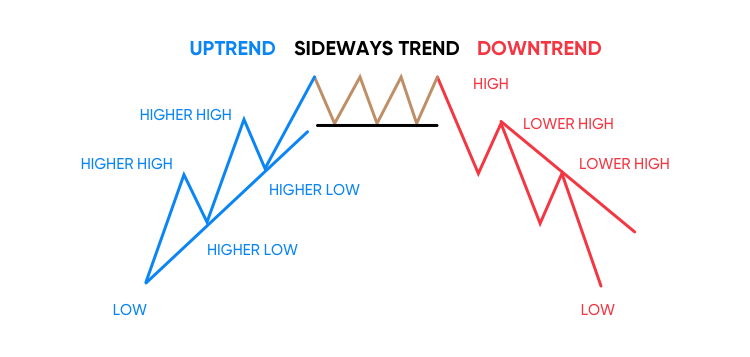
A sideways market in the stock market, also known as a range-bound market, occurs when stock prices fluctuate within a horizontal range, without forming a clear uptrend or downtrend. Instead of making new highs or lows, the stock moves between resistance and support levels, creating a consolidation phase.
Key Characteristics of a Sideways Market
- Lack of a Clear Trend: Stock prices move within a defined range without making significant upward or downward progress.
- Repeated Support and Resistance Levels: Prices tend to bounce between a support (lower boundary) and resistance (upper boundary).
- Low Volatility: Market movements tend to be slow, with reduced momentum.
- Range Trading Opportunities: Traders can buy near support and sell near resistance.
- Breakout Potential: Eventually, prices may break out of the range, leading to a strong uptrend or downtrend.
Why Does a Sideways Market Happen?
Several factors contribute to the formation of a sideways market in the stock market:
1. Market Uncertainty
- When investors lack clarity about economic or geopolitical conditions, stocks may move sideways as traders wait for more information.
2. Lack of Strong Catalysts
- If there are no major economic reports, earnings announcements, or industry developments, stocks may trade in a narrow range.
3. Balanced Supply and Demand
- A sideways market often occurs when buyers and sellers are evenly matched, preventing strong price movements.
4. Profit Booking and Accumulation
- After a strong trend, investors may take profits, causing the stock to move sideways as new buyers accumulate shares.
5. Market Consolidation Before a Breakout
- Stocks sometimes consolidate in a range before breaking out in a new trend direction.
How to Identify a Sideways Market
Recognizing a sideways market in the stock market is essential for making informed trading decisions. Here’s how to identify it:
1. Technical Indicators
- Moving Averages: When short-term and long-term moving averages flatten out, it indicates a sideways market.
- Relative Strength Index (RSI): An RSI between 40-60 suggests neutral momentum.
- Bollinger Bands: When the bands narrow, it indicates low volatility and a sideways market.
2. Support and Resistance Levels
- Draw trend lines to identify key support and resistance levels where prices repeatedly bounce.
3. Low Trading Volume
- A sideways market often features reduced trading volume, indicating a lack of strong buying or selling pressure.
Trading Strategies for a Sideways Market
A sideways market in the stock market can be frustrating, but traders can still profit by using specific strategies.
1. Range Trading Strategy
- Buy near Support: When prices approach the lower boundary, look for buying opportunities.
- Sell near Resistance: When prices reach the upper boundary, consider selling or shorting.
- Use Stop-Loss Orders: Place stop-losses just outside the range to manage risk.
2. Breakout Trading Strategy
- Watch for a breakout above resistance or below support.
- Trade with volume confirmation—higher volume signals a stronger breakout.
- Use stop-losses to prevent losses if the breakout fails.
3. Swing Trading Strategy
- Identify mini-trends within the sideways market.
- Trade small price movements while holding positions for a few days.
4. Options Trading Strategy
- Iron Condors and Straddles can be used to profit from low volatility in a sideways market.
5. Avoid Trend-Following Strategies
- Trend-following indicators like moving averages work poorly in a sideways market.
- Wait for a clear breakout before using trend-based strategies.
Risks Associated with a Sideways Market
Although a sideways market in the stock market can present trading opportunities, it also has risks:
1. False Breakouts
- Prices may briefly break resistance or support but fail to sustain momentum.
2. Whipsaw Movements
- Quick price reversals can stop out traders before a clear direction is established.
3. Low Profit Potential
- Gains may be limited compared to strong uptrends or downtrends.
4. Market Manipulation
- Some stocks with low liquidity may experience artificial price movements.
Strategies for Long-Term Investors
While traders focus on short-term price movements, long-term investors can also benefit from a sideways market in the stock market:
1. Dividend Investing
- Invest in high-dividend stocks to earn passive income while waiting for a breakout.
2. Accumulation Strategy
- Buy quality stocks at lower prices during sideways movements and hold for long-term growth.
3. Portfolio Diversification
- Reduce risk by investing in different sectors to avoid prolonged stagnation in one area.
4. Patience and Risk Management
- Avoid making impulsive decisions—wait for strong breakout signals before taking action.
Sideways Market in Different Market Conditions
1. Sideways Market in a Bull Market
- Often a temporary pause before prices resume an uptrend.
- Investors can use this opportunity to accumulate shares before the next rally.
2. Sideways Market in a Bear Market
- May indicate uncertainty or a potential market bottom before a new uptrend.
- Investors should be cautious about false breakouts.
3. Sector-Specific Sideways Market
- Some sectors may move sideways while others trend higher or lower.
- Investors should analyze sector trends before making investment decisions.
Conclusion About The sideways market in the stock market
A sideways market in the stock market is a phase of price consolidation where stocks move within a horizontal range. While it may seem frustrating, it offers valuable opportunities for range traders and long-term investors who understand how to navigate it.
By using technical indicators, identifying support and resistance levels, and implementing effective trading strategies, traders can profit even in range-bound markets. Long-term investors can focus on accumulating high-quality stocks, diversifying portfolios, and using dividend investing strategies to generate returns while waiting for a breakout.
Understanding a sideways market in the stock market is essential for every trader and investor, as it helps in adapting strategies to different market conditions. Whether you are trading short-term price movements or positioning for long-term gains, mastering the sideways market will enhance your stock market success.
False Breakout in the Stock Market :
False Breakout in the Stock Market: A Comprehensive Guide for Traders and Investors
The stock market is full of surprises, and one of the most deceptive and frustrating events for traders is a false breakout. Many traders experience situations where they anticipate a breakout, enter a trade, only to see the price reverse and hit their stop-loss. But what exactly is a false breakout in the stock market, and how can traders avoid falling into its trap?
In this in-depth guide, we’ll cover what a false breakout is, why it happens, how to identify it, and strategies to minimize losses while taking advantage of such scenarios.
What is a False Breakout in the Stock Market?
A false breakout in the stock market occurs when the price of a stock moves beyond a key support or resistance level but fails to sustain the breakout. Instead of continuing in the expected direction, the price quickly reverses, trapping traders who entered based on the breakout signal.
False breakouts mislead traders into thinking a stock is about to make a significant move, only to see it reverse, leading to losses. They often happen in volatile market conditions and can be a result of market manipulation or a lack of buying or selling pressure after the initial breakout.
Key Characteristics of a False Breakout
- Short-lived Breakout: The price briefly moves beyond a key level but quickly reverses.
- Low Trading Volume: Genuine breakouts typically occur with high volume; false breakouts lack strong participation.
- Wicks or Shadows on Candlestick Charts: Long wicks indicate that the breakout attempt was rejected.
- Failure to Hold Above Support or Resistance: The price falls back into the previous trading range.
- Trap for Breakout Traders: Traders who enter after the breakout may get stopped out as the price reverses.
Why Do False Breakouts Happen?
There are several reasons why false breakouts in the stock market occur:
1. Market Manipulation (Stop Hunting)
- Institutional traders and market makers often push prices beyond key levels to trigger stop-loss orders.
- This forces retail traders out of positions before the price moves in the expected direction.
2. Lack of Volume Support
- A breakout without strong volume often lacks the momentum needed to sustain the move.
3. Trader Psychology (FOMO & Panic Selling)
- Many traders jump into breakouts due to fear of missing out (FOMO), causing temporary price surges that don’t last.
- When traders realize the breakout is failing, panic selling occurs, leading to price reversals.
4. False News or Rumors
- Sometimes, misleading news causes a short-term price spike, followed by a reversal once the truth emerges.
5. Overall Market Conditions
- If the broader market is uncertain or range-bound, breakouts are more likely to fail.
How to Identify a False Breakout
1. Check Trading Volume
- Low volume breakouts are less reliable.
- A real breakout should have high volume confirming the move.
2. Look for Confirmation Candles
- Wait for multiple candlesticks to confirm the breakout.
- Avoid chasing the first breakout candle.
3. Use Moving Averages
- If a breakout moves too far from moving averages too quickly, it may be a false breakout.
4. Observe Price Action Around Key Levels
- A strong breakout should hold above support after breaking resistance.
- False breakouts often return inside the range quickly.
5. Watch for Divergence in Indicators
- If the Relative Strength Index (RSI) or MACD does not support the breakout, it may be false.
Trading Strategies to Avoid False Breakouts
1. Wait for Retest Before Entering
- Instead of entering on the first breakout, wait to see if the price retests the broken level and holds.
- A successful retest suggests a real breakout, while failure indicates a false breakout.
2. Use Stop-Loss Orders Wisely
- Instead of placing stop-losses just outside key levels, give your trade more breathing room.
- Institutional traders often hunt for tight stop-loss orders before the real move happens.
3. Trade with Volume Confirmation
- Only trade breakouts that occur with high volume, indicating real buying or selling pressure.
4. Combine Multiple Indicators
- Use trendlines, moving averages, and RSI together to confirm a breakout.
- If all indicators align, the breakout is more likely to be genuine.
5. Be Wary of Breakouts During Low Liquidity Periods
- Early mornings, late trading hours, or holidays often have false breakouts due to low trading activity.
How to Profit from a False Breakout
While false breakouts are frustrating, experienced traders use them to their advantage.
1. Fade the Breakout (Contrarian Strategy)
- If you identify a false breakout, trade in the opposite direction after confirmation.
- Sell (short) near resistance if the price fails to hold.
- Buy near support if a false breakdown occurs.
2. Use Options Trading Strategies
- Buying puts on false breakouts can be profitable.
- Selling credit spreads can take advantage of price reversals.
3. Trade Fakeout-Reversal Patterns
- Watch for candlestick patterns like engulfing candles or pin bars that signal a reversal.
Risks of Trading False Breakouts
Even though false breakouts can create opportunities, they also come with risks:
1. Getting Stuck in Whipsaw Movements
- Prices may move unpredictably, causing quick stop-outs.
2. Psychological Stress
- Frequent false breakouts can frustrate traders and lead to emotional decision-making.
3. Overtrading in Choppy Markets
- Too many trades in range-bound markets can lead to losses.
False Breakouts in Different Market Conditions
1. False Breakouts in Bull Markets
- Some breakouts in bull markets fail due to profit booking or resistance levels.
- Traders should be cautious of entering after extended rallies.
2. False Breakouts in Bear Markets
- Bear markets often have false upside breakouts that trap buyers before another decline.
3. Sector-Specific False Breakouts
- Some stocks experience false breakouts due to temporary sector momentum.
- Always analyze the bigger market trend before trading.
Conclusion
A false breakout in the stock market occurs when prices temporarily move beyond key levels but fail to sustain momentum. These fakeouts are common and can lead to losses for unprepared traders.
However, by understanding why false breakouts happen, using technical analysis, and applying smart trading strategies, traders can reduce losses and even profit from these situations.
Key Takeaways:
- Always wait for confirmation before entering a breakout trade.
- Use volume analysis and multiple indicators to validate breakouts.
- Manage risk with proper stop-loss placement to avoid getting trapped.
- If identified correctly, false breakouts can be traded profitably using reversal strategies.
Mastering the false breakout in the stock market will make you a better trader, helping you avoid unnecessary losses and capitalize on market traps.
False Breakdown in the Stock Market:
False Breakdown in the Stock Market: A Trader’s Guide to Avoiding Market Traps
The stock market is full of deceptive moves that can trap even experienced traders. One of the most frustrating occurrences is a false breakdown, where a stock price appears to be crashing through key support levels, only to reverse and move back up. Many traders fall victim to this trap, selling their positions or shorting the stock just before it rebounds. Understanding how a false breakdown in the stock market works is crucial to avoiding losses and even profiting from these situations.
In this in-depth guide, we’ll explore what a false breakdown in the stock market is, why it happens, how to identify it, and strategies for turning it into a profitable trading opportunity.
What is a False Breakdown in the Stock Market?
A false breakdown in the stock market occurs when the price of a stock moves below a critical support level but fails to sustain the breakdown. Instead of continuing lower, the price reverses and moves back up, trapping traders who sold or shorted the stock based on the breakdown signal.
False breakdowns can be frustrating because they create the illusion of a major bearish move, leading traders to exit positions at the worst possible time. These breakdowns often happen in volatile market conditions or as part of market manipulation by institutional investors.
Key Characteristics of a False Breakdown
- Short-lived Move Below Support – The price temporarily breaks below support but quickly reverses.
- Low Trading Volume on the Breakdown – A genuine breakdown should have high volume; a false breakdown usually lacks strong selling pressure.
- Quick Recovery Back Above Support – The stock regains its previous price range shortly after breaking down.
- Stop-Loss Triggers for Retail Traders – Many traders set stop-loss orders below support, and market makers often push prices down just to trigger these stops before reversing the move.
- Trap for Bearish Traders – Traders who short the stock expecting further decline may get caught when the price reverses.
Why Do False Breakdowns Happen?
There are several reasons why false breakdowns in the stock market occur:
1. Market Manipulation (Stop Hunting)
- Large institutional traders push the price below support to trigger retail stop-loss orders.
- Once retail traders are forced out, institutions buy at lower prices, causing the stock to reverse.
2. Lack of Selling Pressure
- If a breakdown occurs on low volume, it may indicate a lack of strong bearish conviction.
- Without enough sellers, the stock price naturally rebounds.
3. Psychological Reactions from Traders
- Traders panic and sell when they see a breakdown, leading to temporary price drops.
- Once the panic subsides, buying pressure pushes prices back up.
4. False News or Rumors
- Negative news may cause a temporary sell-off, but when the truth emerges, prices recover.
5. Market Conditions Favoring Range-Bound Trading
- In choppy or sideways markets, breakdowns often fail to gain momentum and reverse quickly.
How to Identify a False Breakdown
1. Check Trading Volume
- A true breakdown should have high selling volume.
- If the volume is low, it could be a false breakdown.
2. Observe Price Action After the Breakdown
- If the price bounces back above support within a few candles, it’s likely a false breakdown.
3. Look for Candlestick Patterns
- Pin bars (long lower wicks) suggest buying pressure at lower levels.
- Bullish engulfing candles after a breakdown signal a reversal.
4. Use Moving Averages
- If a breakdown occurs too far below moving averages and quickly snaps back, it may be false.
5. Watch for Divergence in Indicators
- If RSI or MACD doesn’t confirm the breakdown, it could be a false move.
Trading Strategies to Avoid False Breakdowns
1. Wait for Confirmation Before Entering Trades
- Don’t immediately short a stock just because it breaks support.
- Wait for multiple confirmation candles closing below support before acting.
2. Use Wider Stop-Loss Orders
- Instead of placing stops right below support, give some extra room to avoid being shaken out.
3. Trade with Volume Confirmation
- A breakdown should have high volume to be reliable.
- Low-volume breakdowns are more likely to be false.
4. Combine Multiple Indicators
- Use trendlines, moving averages, RSI, and MACD to confirm the breakdown.
5. Avoid Trading Breakdowns in Choppy Markets
- False breakdowns are common in range-bound markets.
- If the stock is moving sideways, be skeptical of breakdowns.
How to Profit from a False Breakdown
While false breakdowns are frustrating, experienced traders use them to their advantage.
1. Fade the Breakdown (Contrarian Strategy)
- If a false breakdown is identified, buy the stock after confirmation of a reversal.
- Set a stop-loss below the lowest breakdown point to manage risk.
2. Use Options Trading Strategies
- Buying calls after a false breakdown can be profitable.
- Selling put credit spreads allows traders to take advantage of the reversal.
3. Trade Fakeout-Reversal Patterns
- Watch for bullish engulfing candles or hammer candlesticks that indicate a reversal.
Risks of Trading False Breakdowns
Even though false breakdowns can create opportunities, they also come with risks:
1. Getting Trapped in Whipsaw Movements
- Prices may move unpredictably, leading to quick stop-outs.
2. Psychological Stress
- False breakdowns can cause traders to doubt their strategy and make impulsive decisions.
3. Overtrading in Choppy Markets
- Too many trades in range-bound markets can lead to losses.
False Breakdowns in Different Market Conditions
1. False Breakdowns in Bull Markets
- In strong bull markets, breakdowns often fail due to buying pressure.
- Investors use these breakdowns as buying opportunities.
2. False Breakdowns in Bear Markets
- Some bear market rallies begin with false breakdowns, trapping short-sellers before a major reversal.
3. Sector-Specific False Breakdowns
- Some stocks experience false breakdowns due to temporary sector weakness.
- Always analyze the broader market trend before making a decision.
Conclusion
A false breakdown in the stock market occurs when a stock price temporarily moves below a key support level but fails to sustain the move, reversing back upward. These fakeouts are common and can lead to losses for unprepared traders.
However, by understanding why false breakdowns happen, using technical analysis, and applying smart trading strategies, traders can reduce losses and even profit from these situations.
Key Takeaways:
- Always wait for confirmation before shorting a stock on a breakdown.
- Use volume analysis and multiple indicators to validate breakdowns.
- Manage risk with proper stop-loss placement to avoid getting trapped.
- If identified correctly, false breakdowns can be traded profitably using reversal strategies.
Mastering the false breakdown in the stock market will improve your trading skills, helping you avoid unnecessary losses and capitalize on market traps.